Watching Birds, Tracking Climate
Along the Atlantic Flyway
It's early spring 2010, and Rick Petersen is slogging through the mud at Merchants Millpond State Park, the remnants of a pink dawn reflected in the black waters of the pond. Historically, the millpond has been a stopover point for migrating birds as they move north to their summer feeding grounds. However, in a changing climate, the numbers of some types of birds and the dates that they show up is also changing. What kinds of birds would he see this year?
Here in the northeast corner of North Carolina, Petersen is moving through an enchanted forest of huge cypress and tupelo trees decked with Spanish moss and resurrection fern; a mosaic of duckweed and water fern cover the pond's surface. The pond itself covers 750 acres, surrounded by 3,000 acres of mixed pine and hardwood forest interspersed with shimmering stands of American beech.
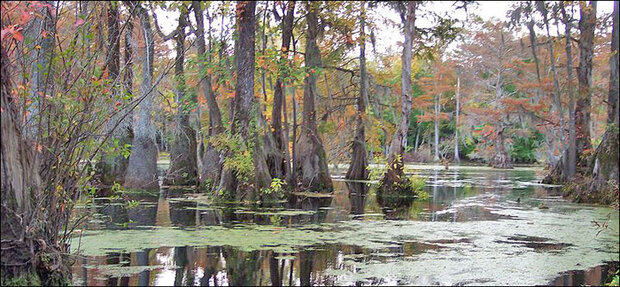
Merchants Millpond State Park, near the border of North Carolina and Virginia. Photo courtesy of bobistraveling.
Petersen likes to get out to Merchants Millpond in the spring, before the humidity, ticks, and deer flies get too bad. There aren't too many people around at this time of year either. And though he doesn't usually see many animals on the ground, there are plenty here-deer, beaver, bobcats, grey fox, black bear, and snakes.
Some 200 species of birds have been sighted in the park. All through spring, birders show up at the pond with high expectations for spotting colorful migrants-northern parulas, swamp warblers, and yellow-throated warblers-making their way back from the southern tropics to northern breeding grounds. They might also see turkeys, egrets, owls, pileated woodpeckers, and hooded mergansers.
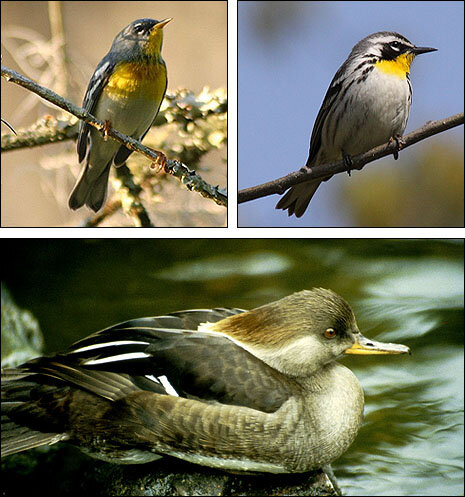
Spring sightings at Merchants Millpond State Park include the northern parula, upper left, yellow-throated warbler, upper right, and hooded merganser, bottom. Photos courtesy of Daniel Berganza, Domenic Sherony, and Glen Smart.
Petersen is particularly excited about his sightings of the red-cockaded woodpecker, an endangered species that prefers to nest in older longleaf pine trees and is rarely sighted at the millpond. "I'm not a professional birder," he says. "So when I see something like the red-cockaded woodpecker, it's a real discovery for me."
Though he claims not to be a professional, Petersen started birding when he was 10 years old, and now counts some 150 birds on his life list. He grew up in New Hampshire and worked 30 years for the Coast Guard, living all over the United States. Elizabeth City, where Petersen has lived the past 10 years, lies about an hour from the North Carolina coast and right in the Atlantic Flyway, one of four major routes that migratory birds take in spring as they leave their winter feeding grounds to fly north to their summer breeding grounds.
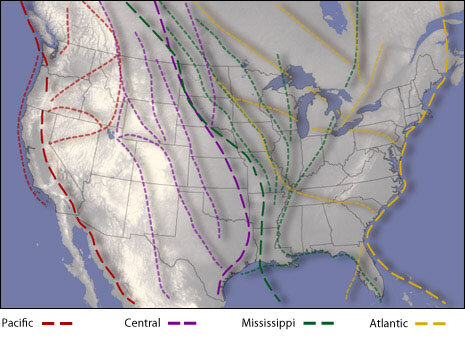
Bird migration flyways of North America. Image courtesy of Hunter Allen.
Over the years, Petersen and his wife Karen have noticed changes in the patterns of the birds flying through. "There used to be more snow geese, for instance," he says. "One of the biggest changes is that you don't see certain birds anymore. My wife and I talk about the trends, like 'Didn't we used to have more chickadees and thrashers at the feeder?' If you don't pay attention to the types of birds that are visible every day, you might not notice the difference."
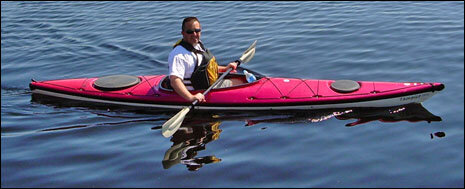
Rick Petersen goes where the birds are, sometimes by kayak. Photo courtesy of Karen Petersen.
Recognizing short-term trends in numbers of birds takes continuous attention. In order to know how bird populations and migration patterns change over longer time scales-seasons, years, or decades-observers need to record their sightings over time, and compare them with observations from other locations. Though Peterson's main motivation for birdwatching is to satisfy his own personal interest and sense of adventure, he's also found a way to contribute his time to a vital new effort to build a long-term record of the nation's bird distribution…
At First Sight
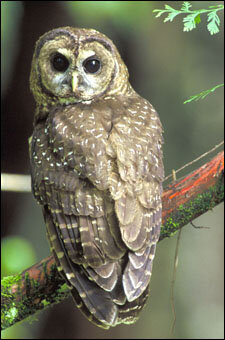
Among the first bird migration cards scanned was one that documented the sighting of a northern spotted owl. Photo by John and Karen Hollingsworth, courtesy of the U.S. Fish & Wildlife Service National Digital Library.
In the United States, people have made note of the seasonal return of birds for over two centuries. The most famous example is the swallows of Capistrano in southern California. In the late 1700s, the mission padres started recording the return of cliff swallows to their nests under the eaves of the Mission of San Juan Capistrano on March 19 of each year. The recurring event became widely known through a popular song in the 1940s.
The first arrival date-the day that an observer first sees or hears an individual bird of a species that has been absent for a season-has become an important measure of phenology, the study of the relationship between recurring natural events such as bird migration or plant budburst and seasonal changes.
For untold years, winter-weary birdwatchers have been recording first arrival dates in diaries, journals, field notebooks, and bird checklists. However, before 1900, there simply wasn't much known about bird migration. In 1881, Wells W. Cooke, a naturalist then teaching at the White Earth Indian Reservation in Minnesota, started recruiting his friends to note their observations about bird migration. Cooke wondered whether birds arrived and departed on the same dates every year. He collected the information from his friends and transcribed it onto cards that he sorted by species, then by location and date.
Enter C. Hart Merriam, a medical doctor turned natural scientist, who developed the influential "life zones" theory to explain distributions of animals and plants. In 1883, as a charter member of the newly formed American Ornithologists' Union, Merriam expanded Cooke's initial work. Within 10 years, the network of birdwatchers included 3,000 volunteers and covered all of the United States, Canada, and part of the West Indies. Volunteers used standard two- by five-inch cards to record arrival and departure dates of the bird species they saw in their locality. Completed cards, sometimes including observers' personal notations, were sent to Merriam's office to become a part of the research record.
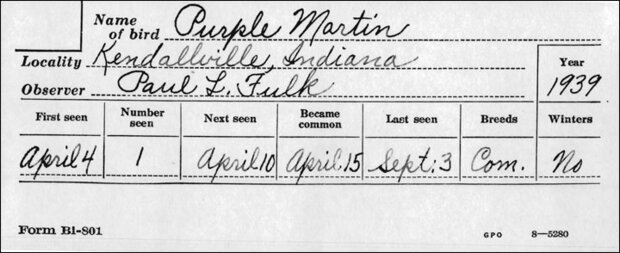
This sample migration card shows that in Kendallville, Indiana in 1939, breeding purple martins became common in mid-April, and they were in the area until early September. Image courtesy of USGS.
In 1885, Merriam took the program and its records with him to a new job in Washington, D.C., where they stayed for the next 35 years. In the 1920s, Fred Lincoln, who also operated a bird banding laboratory, took over the program and collection of the cards. In 1936, when the Patuxent Wildlife Research Center was founded in Laurel, Maryland, Lincoln and the cards moved there as part of the first wildlife research center in the United States.
USGS senior scientist Chan Robbins, organizer of the North American Breeding Bird Survey in the 1960s, took over the migration-tracking program in the mid-1940s. By 1970, however, participation had declined to a small fraction of its peak, so the program stopped accepting cards and was closed.
Saved for the Digital Age
Every migration season, observers submitted a separate card for each species of bird they saw. With more than 3,000 observers, 850 species of birds, and 90 years of sightings, the program ended up with more than 6 million handwritten records! Lined up end to end, the cards would stretch almost 500 miles, roughly the distance from Boston to Washington, D.C. Stored at Patuxent, the cards filled 41 vintage-style olive-green filing cabinets.
The collection represented a huge collective effort, and contained valuable data that was unavailable anywhere else, but without an active program, the records went on the move. They were in danger of being thrown out with every shift to basement, leaky attic, or offsite storage unit. Robbins, though no longer officially responsible for the program, saved the cards from destruction more than once, and kept track of where they were stored.
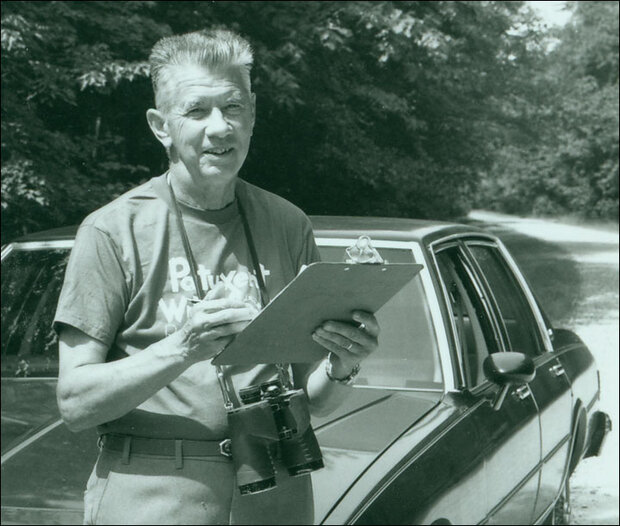
Chan Robbins, an avid birder himself, kept track of the observation cards for five decades, ensuring their preservation even after his retirement. Photo courtesy of Barbara Dowell.
When wildlife biologist Sam Droege came on board at Patuxent in 1996, he learned about the cards through Robbins, and started looking into them. The potential value of 90 years of observations across North America was obvious to him, but stored as individual handwritten notes, the rich data were, for all intents and purposes, inaccessible to researchers. Droege realized that if the observations could be compiled into a computer database, the collection would provide important data on bird populations, and facilitate new insights on bird distribution and the impacts of climate change. But he didn't have a clue how he might get six million observations digitized.
Droege kept thinking about the cards and started working with them, taking over guardianship of the collection, publishing a preliminary article about their value for research, and securing funding to get them moved back to Patuxent. Through his continual efforts, Droege eventually pulled together a small amount of funding to address possibilities for getting the data digitized.
Jessica Zelt, then working as a research assistant at the Smithsonian Institute Migratory Bird Center, took the job to coordinate digitization of the cards under a project known as the North American Bird Phenology Program, or BPP. Zelt's salary was about all the funding the program had in its first year; her challenge was to somehow get the millions of records scanned and then transcribed into a database without spending any money.
"The cards were on all kinds of paper," says Zelt. "In some cases the paper was so thin you could see through it. We had to figure out how to scan the cards. We also needed to get the scanned images online, and enlist people to look at the cards and transcribe the information to populate the database."
Zelt recruited volunteers from the Washington, D.C., and Baltimore, MD, area to come out to the wildlife center to sort and scan cards. After working out some kinks in the process, and building up enough scanned images that transcribers would have a steady supply of cards, the program called for volunteers who would commit time to transcribing the bird migration data. Rick Petersen was among the first group of people who responded to the call.
Birds and Climate

Jessica Zelt searches for a specific observation card among the many file cabinets that house the collection. Photo courtesy of David Deal.
"Think about it. You can't go back 120 years and reconstruct records like these that cover all of North America and over 850 species," says Zelt. "It would be very difficult-almost impossible-to document past bird distributions without these records."
Indeed, even with satellite tracking, digital databases, studies that tracked individual birds by placing small metal bands on their legs, and numerous organized bird counts and surveys, no single source of bird data provides as long a record across so large an area for as many species as the Bird Phenology Program.
"Because it stretches back to the 1880s, the observation data can be used as a baseline to compare to more recent data," says Zelt. "When combined with current information, scientists will better understand how birds are responding to climate change and how to develop tools to help manage that change, especially for at-risk species."
Studies show that some species of Neotropical migratory birds-those that winter in the tropics and fly north for summer breeding-are shifting their migratory patterns and breeding ranges: some are moving farther north at earlier times, others are moving farther inland from the coasts. These changes could result in populations migrating to areas where forest habitat is too scarce for successful breeding, or arriving in feeding areas before the plants or insect populations they consume are large enough to support them.
Researchers are working to understand and predict how the locations of migration paths and breeding areas may shift under new climate conditions. With this information, natural resource managers can start developing decision-support tools to assist them in managing potential flyways and regions that may become feeding and nesting areas.
Resource management efforts might also be used to enhance habitat for birds whose numbers are already decreasing. At least 29 species of migratory birds are currently in serious decline; species such as the cerulean warbler and the olive-sided flycatcher have declined as much as 70 percent since the 1960s. Ensuring that adequate habitat remains available to these species as climate conditions change could help these reduced populations thrive.
Another Network Revival
The USA National Phenology Network brings together citizen scientists, government agencies, non-profit groups, educators and students of all ages to monitor the impacts of climate change on plants and animals in the United States. The network harnesses the power of people and the Internet to collect and share information, providing researchers with far more data than they could collect alone.
In March 2009, the Bird Phenology Program joined forces with the USA National Phenology Network, a program with its roots in plant phenology. The program started in the 1950s, when Joseph Caprio at Montana State University recruited a network of volunteers to report blooming dates for common lilacs and honeysuckle plants. Eventually gathering observations from more than 2,500 volunteers across 12 Western states, the program lasted until the mid-1990s. Parallel projects also started in the Eastern United States. In 2005, existing lilac observatory stations were combined with a new Native Species Observation Program to form a plant phenology network for the entire United States.
Meanwhile, researchers from university, federal, and other settings started meeting to organize what would become the National Phenology Network, a Web site that lets citizens and scientists enter observations directly into an online database. In 2007, the U.S. Geological Survey and the University of Arizona opened the coordinating office for the new network in Tucson, Arizona, with U.S. Geological Survey ecologist Dr. Jake Weltzin as executive director.
"The U.S. Geological Survey provides a leadership role for the program," says Weltzin. "But the actual network is based on a new model that supports involvement from federal, state and local agencies, tribes, non-governmental organizations, academics, resource managers, educators, and the public. If you're a contributor, you're a member."

A network participant records phenology observations in the field. Photo courtesy of T. Crimmins.
The goal of the program is to develop a nationwide network of phenology observers-from citizens to professional scientists-observers who use standardized methods to make and record their observations of phenological events, including diverse events such as flowering, frog calling, and bird migration. In spring 2010, the network went live with Nature's Notebook, an online phenology program where observers can record their observations of over 200 different plant species and 58 different animal species. The program will also integrate historical data with today's observations to provide a better understanding of recent changes in phenology and their ecological impacts.
The USA National Phenology Network and the Bird Phenology Program linked up in 2009, courtesy of funding from the U.S. Fish and Wildlife Service. "Fish and Wildlife had some money to put into phenology," says Weltzin. "Half came to the our network to develop the animal monitoring part of our program, and the other half went to the Patuxent Wildlife Research Center to rescue the six million data cards."
One Card at a Time
As of March 2010, the Bird Phenology Program included 14 volunteers who scan cards in the office, and more than 1,750 transcribers who, like Rick Petersen, contribute their efforts online. In the first year of the program, volunteers' combined efforts resulted in over 580,000 records entered into the database. Unfortunately, that leaves almost 5.5 million to go. At the current scanning rate of 35,000 records a month-no small feat-it would take 13 more years just to get the images online.
As the number of volunteer transcribers and their production of records continued to increase, Zelt and others anticipated the potential downside of this happy situation. "The transcribers online are simply outworking us," says Zelt. "We are just trying to keep up with their pace."
Adding additional urgency to the scanners' task, the volunteers who key and transcribe the scanned records recently started a friendly competition to see who could enter the most records. As spring 2010 rolled around, it became apparent that before too long, the scanners were going to fall behind the transcribers. Several small data rescue grants from U.S. Geological Survey were helpful, but the number of cards remaining to be scanned was simply overwhelming.

Some of the office and online volunteers who contribute their time scanning and transcribing observation cards for the Bird Phenology Program.
Help for the Scanners
Fortunately, Tim Owen, deputy chief of climate services at NOAA's National Climatic Data Center, had recently joined the National Phenology Network's Board of Directors. He knew just where to go to get help with the scanning-NOAA's Climate Database Modernization Program.
The Climate Database Modernization Program began in 2000 as an effort to improve access to the full range of the Nation's climate data, much of which was still recorded on paper, film, and other fragile media. Documents that contain climate data include weather observations recorded in diaries and journals by early Americans such as Thomas Jefferson and Benjamin Franklin as well as rare publications, maps, and charts stored in various NOAA libraries. Data rescued from other agencies include historical images and data on whales and coral reefs from the National Marine Fisheries Service, historic tide and shoreline information from the National Ocean Service, and European ship logbooks from the 1700s. Every year, the program scans millions of documents, including historical photos, maps, and charts, categorizing the images to integrate them into larger databases now available to researchers and members of the public around the world.
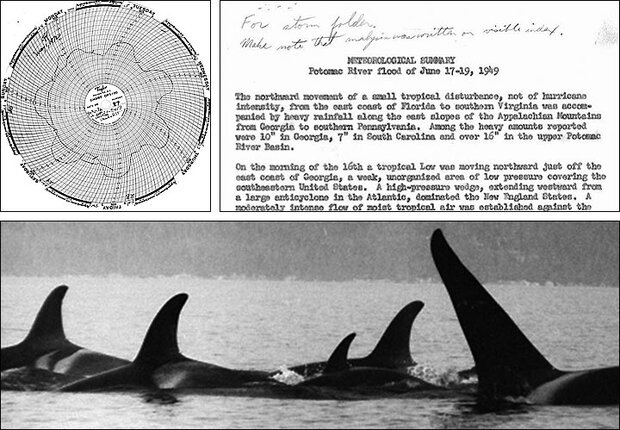
Examples of documents scanned by the Climate Database Modernization Program. The figure on the left shows a continuous temperature record from April 21 to May 1, 1972 at Nashville, Tennessee. The report on the right details heavy rains and flooding that occurred along the eastern seaboard from June 17-19, 1949. The bottom image is from a set of historical photos and negatives scanned for NOAA Fisheries. Images courtesy of NOAA.
In fall 2009, the Bird Phenology Program applied and received a commitment for help in scanning the bird migration cards. "We're glad to be able to support this project," says Tom Ross, program manager of the Climate Database Modernization Program. "All the data we rescue extends our view into the past. This particular dataset will provide a unique view of birds as indicators of climate conditions."
The Climate Database Modernization Program manages around 100 climate and environmental data rescue projects. These projects employ over 300 people in private sector jobs to perform the imaging, categorizing, and database development necessary to make the data available through modern computers. Each rescue effort involves detailed instruction on scanning and output requirements, and attention to detail is paramount: "It takes a lot of time and resources to scan millions of records and then perform quality control to check the output," says Ross. He should know; he's got over 100 million records lodged in the basement of NCDC's offices in Asheville, North Carolina, and many of them have yet to be scanned or categorized.
With scanning help from the Climate Database Modernization Program, the six million bird migration records could all go online for transcription within the next few years. When transcription is finished, the free online database will provide a powerful resource both for climate change research and for adaptation planning.
The process for getting the data from the scanned bird migration cards into the growing database-which Weltzin calls "crowdsourcing"-is equally important. "The crowdsourcing model developed for this project allows people all over the world to go online and enter data from the cards. The strategy is especially valuable because the cards and handwriting are not uniform, so they can be difficult for machines to read," says Weltzin. "If it's as effective as we think it is, we could use this model to rescue critical and forgotten data stored in federal agencies, universities, and basements across the Nation."
Connecting to the Cards
Are the transcribers thinking about the big picture of phenology and climate change while they read the cards and type online? For many, what the cards have to offer is more personal. Some of the observers' names on the cards are those of famous birders, names that may strike a chord with the transcriber, linking them into the legacy of birding and history. Among these are Teddy Roosevelt, a renowned naturalist who served as our 26th president, James Bond, an avid birdwatcher after whom Ian Fleming named his most famous character, and Robert Birdseye, the father of the frozen food industry.
And some of the cards name extinct birds such as the great auk and the passenger pigeon, species that are now only seen in illustrations and grainy early photographs. Another species that is now extinct, the Carolina parakeet-the only parrot native to North America-was once a common sight at Merchants Millpond.
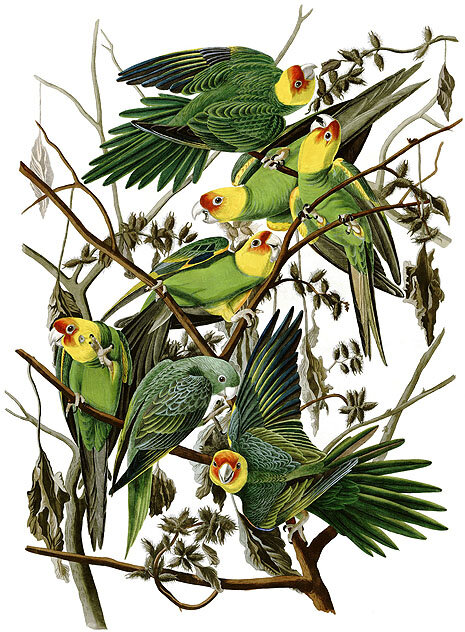
John James Audubon produced this illustration of Carolina parakeets sometime around 1830. The last known birds of this species died in the early 1900s.
Petersen figures he's transcribed about 1,000 cards so far. "You can do a card very quickly, in a couple of minutes," he says. "It seems like in the long run it will provide valuable data that will help us figure out what's going on in the flyways."
Like many other transcribers, he's also interested in what he finds on the cards themselves. "I like the bird side and the history side," he says. "Then you throw in some geography, and it becomes interesting to me in three ways. Sometimes I put in a card from a place where I used to live," says Petersen. "I find myself wondering if that person stood in the same spot I did, and what they saw."
In a similar manner, Petersen wonders if future birders will look back on the observations he's made at Merchants Millpond. Looking about at the unique habitat, he says, "I hope they have the chance to see some of the same types of beautiful birds that I've seen here."
Zoe Hoyle is a science writer and editor for the USDA Forest Service Southern Research Station.
-
Links to further information:
North American Bird Phenology Program
Patuxent Wildlife Research Center
USA National Phenology Network
NOAA's Climate Data Modernization Program
Additional reading:
Audubon Society. 2009. Birds and climate change: ecological disruption in motion. NY: Audubon Society. 16 p. Accessed April 14, 2010.
Droege, Sam. 2003. Spring arrivals of Maryland and Washington, D.C. birds. Maryland Birdlife. 59 (1,2): 3-11. Accessed April 7, 2010.
Faaborg, John, Holmes, Richard T., Anders, Angela D. et al. 2010. Recent advances in understanding migration systems of New World land birds. Ecological Monographs 80(1): 3-48. Accessed April 15, 2010.
Hitch, Alan T., and Leberg, Paul L. 2007. Breeding distributions of North American bird species moving north as a result of climate change. Conservation Biology 21(2) 534-539.
Price, Jeff, and Glick. M.S. 2002. The birdwatcher's guide to global warming. Reston, VA: National Wildlife Federation and American Bird Conservancy. 30 p. Accessed April 14, 2010.