Who Rules California's Russian River?
Part 1: All Eyes on the Storm
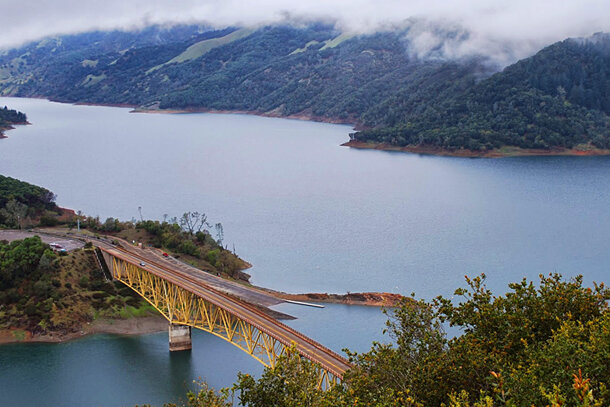
Lake Sonoma, a reservoir in northern Sonoma County created by the construction of Warm Springs Dam. Credit: Water Environment Research Foundation.
Wednesday is market day in the city of Santa Rosa, California. Jay Jasperse takes a walk through his local farmers market on a summer day and finds baskets and carts filled with juicy tomatoes, knobby roots, and sweet-smelling herbs. Signs propped up on the rows of booths advertise wine tastings. Just down the road, local giants like Kendall Jackson and E&J Gallo compete on an international scale.
When Jasperse browses produce at the market, he sees beyond the spectrum of earthy colors and the familiar faces behind the counters. He sees the complicated workings behind many of the items on the shelves, such as a bottle of wine.
He sees how the region’s climate—warm and dry in the summer, and cool and wet in the winter—makes winegrowing possible here.
How a winegrower fastidiously watches over his vines until the hot summer sun has stressed the grapes to perfection.
How one unexpected, deadly frost could compromise an entire year’s harvest.
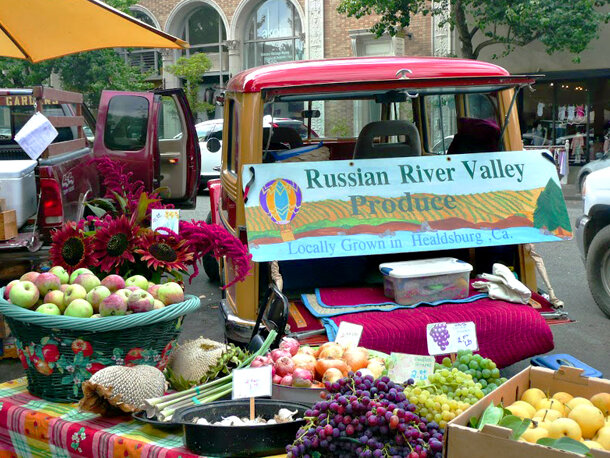
Farmers put fresh produce on display at one of region's local markets. NOAA Climate.gov photo by Caitlyn Kennedy.
The wine, the produce, and everything else at this farmers market depend upon the Russian River in some way. As Chief Engineer for the Sonoma County Water Agency, Jasperse always has one finger on the pulse of the river—a 110-mile long artery that winds through California’s Sonoma and Mendocino counties. It’s the water agency’s job to keep the region’s water system in balance so that everyone and everything gets its share, even when drought, floods, or frost strikes the region.
Take this year, for instance. With less than half of its normal rainfall for this water year to date, Sonoma County is currently experiencing its driest period on record. Water levels in Lake Mendocino—the smaller and more vulnerable of the region’s two major reservoirs—have dropped to a near historic low storage level for this time of year. This reservoir provides water to several communities and farmers in Mendocino and Sonoma Counties.
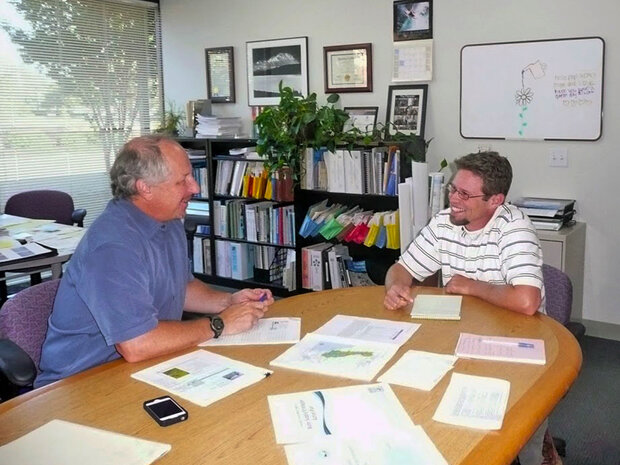
Water engineers Jay Jasperse (left) and Chris Delaney (right) discuss current water conditions at the Sonoma County Water Agency office in Santa Rosa, California. NOAA Climate.gov photo by Caitlyn Kennedy.
As familiar as water agency managers and engineers are with the river and its rhythms, they are less familiar with the invisible river in the sky that has a major impact on the region’s water supply. In mid-February, a large “atmospheric river” brought some much-needed rainfall to the region, although not enough to alleviate the current drought emergency. If relief does not come in the next few months, Californians will face significant cutbacks in water use to prevent the lake from going dry in the fall.
Water shortages during dry years affect the interests of both winegrowers and conservationists in the region, and they leave water managers trying to strike a careful balance. Jasperse and his colleagues at the water agency are turning to science as a way to find compromise when water conflicts arise. It won’t be easy, though. While three protected species of fish may have a lawful claim to the Russian River, the winegrowers and their vines rule the land.
When the Rain Stops
California’s Russian River begins in Mendocino County and ends at the Pacific Ocean in Sonoma County. At many points along its winding curves, miles and miles of grape vines extend out from the riverbank and crawl across the rolling landscape. Heavy fog masks the green and tan hills in the distance.
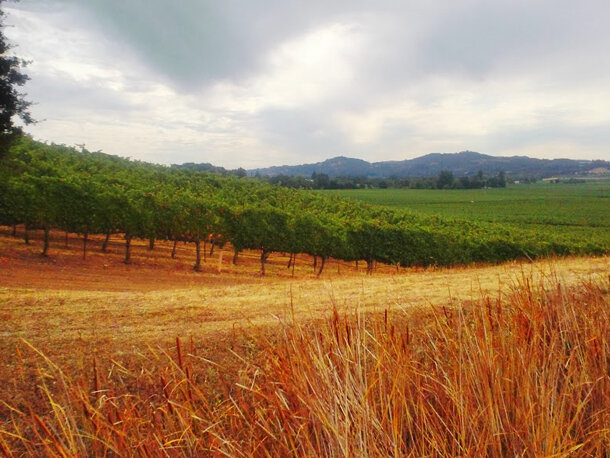
In Sonoma County, a complex interaction of geology, topography and maritime influences have created a patchwork of microclimates that yield diverse styles of wine. NOAA Climate.gov photo by Caitlyn Kennedy.
Jasperse drives past miles of vineyards every day on his scenic commute to the Sonoma County Water Agency office in Santa Rosa, California. He explains that the local climate is similar to that of Europe's Mediterranean region, which is famous for its winemaking.
“We typically have warm, very dry summers and cool, wet winters. Most of our rainfall occurs from November through May, and it’s very unusual if we get any rainfall in other parts of the year. Because it’s all concentrated during the winter, it takes a lot of planning to make sure we have enough water in storage to last us through the year.”
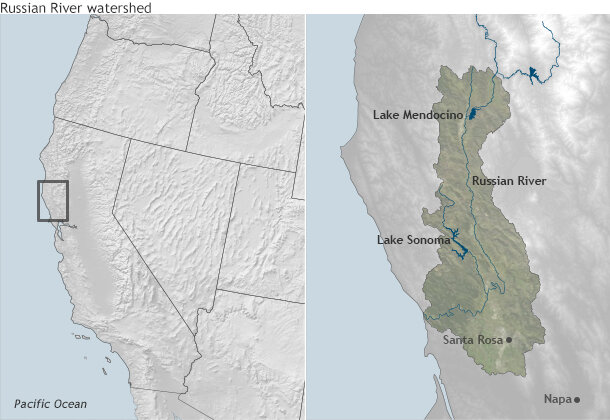
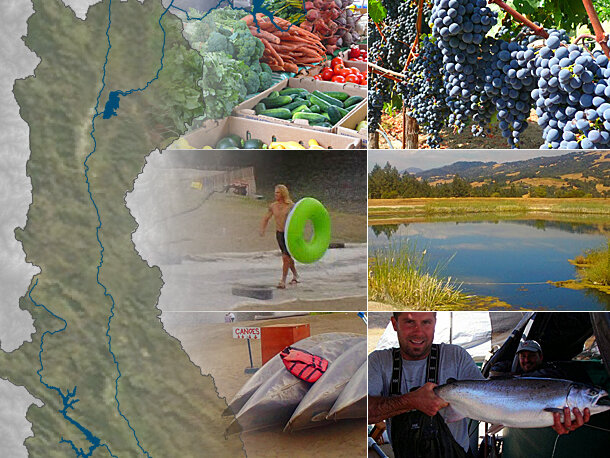
The Russian River drains a 1,485-square-mile watershed in Mendocino and Sonoma counties in California. There are two major dams in the watershed, creating Lake Mendocino and Lake Sonoma. Map by NOAA Climate.gov.
The water agency’s main job is to provide drinking water to about 600,000 people living and working in California’s Sonoma and Marin counties. Working with the U.S. Army Corps of Engineers, the agency helps operate two dams in the Russian River watershed: the Coyote Valley and Warm Springs dams. The agency also supports local stormwater and wastewater systems that are outside the jurisdiction of local communities, such as the City of Santa Rosa.
But since water is vital for many facets of life in Sonoma County, the agency is involved in a range of projects all closely tied to maintaining a healthy and sustainable river: carbon mitigation and clean energy generation projects aimed at improving the water system’s energy efficiency; water conservation initiatives; fisheries research and monitoring activities; and serving the needs of the region’s water-dependent industries, such as farmers, winegrowers, and other business owners.
If the water managers do their job right, none of these interests have to suffer a lack of water. During the dry period of the year, the agency turns to two major reservoirs: Lake Mendocino and Lake Sonoma.
The agency releases water from the reservoirs throughout the summer to ensure that they meet the minimum streamflow in the river that is mandated by the California State Water Resources Control Board. Engineers also inflate a giant rubber barrier in the river that slows down the water, allowing more of it to be diverted at the agency’s collection system located along the river bank.
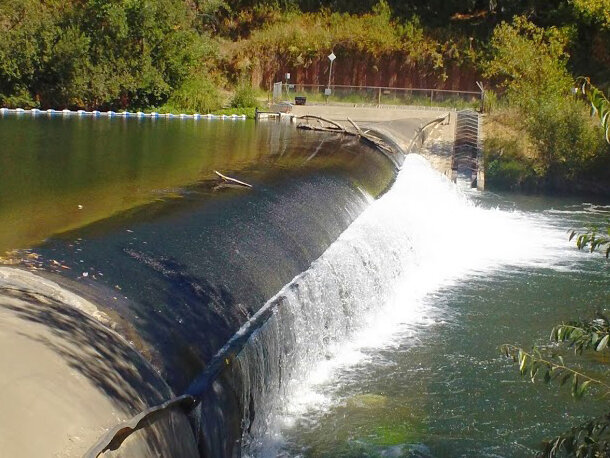
The Sonoma County Water Agency operates an inflatable dam on the Russian River to increase production capacity during peak demand months. Permanent fish ladders on the side of the river allow fish swim past the barrier when it is inflated. NOAA Climate.gov photo by Caitlyn Kennedy.
A secure water supply is critical for people living in Sonoma County during the summer when the only other relief from the hot sun is a dip in the river itself. During the winter, however, the Pacific goes into overdrive, churning up giant storms off the coast. Then, the agency’s focus turns to safeguarding the river against too much water.
New Year, Big Flood
March 2011 was a stressful time for the Sonoma County Water Agency to be planning and hosting a workshop. Water agency managers, including senior engineer Chris Delaney, were painfully aware that things weren’t looking good in the Russian River watershed—the river’s water levels were too low, and there was talk of declaring a drought warning.
Still, the conditions emphasized the need for a workshop in the first place. The water agency was getting together with a group of agencies and organizations at the federal, state, and local levels to discuss how they could work together to help people better prepare for extreme events, like droughts and floods, in the future.
As the workshop approached, the forecast got interesting. A storm popped up on the forecast quite suddenly. Not just your average rainstorm—an unrelenting, whopper of a storm that helped ease fears of drought in the upcoming year.
“We had kind of a miracle March that year,” Jasperse says. “We had two storms back to back that allowed the system to rebound entirely in a period of two weeks. We basically went from one extreme—drought—to another very acute extreme where we had some urban flooding.” He snaps his fingers. “Just like that.”
“It’s amazing how fast that can happen,” Delaney agrees. “We’ll get the bulk of our precipitation from these extreme storms. ”
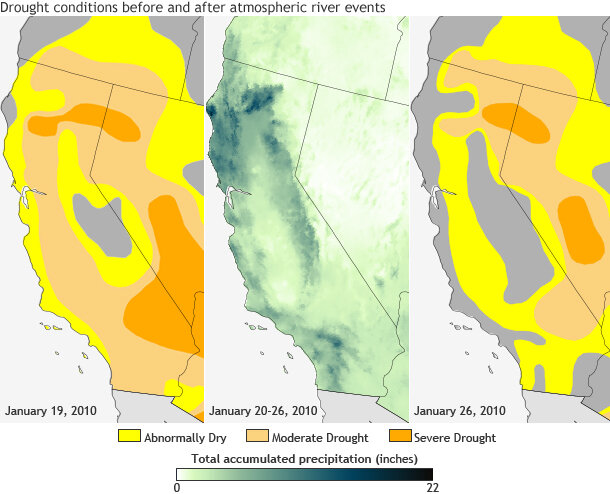
Moderate to severe drought dominated California as of January 19 (image left). Then two atmospheric river events hit the Californian coast in the same week—one in the northern half and one in the southern half (middle). By the end of the week (image right), drought had significantly abated. NOAA Climate.gov maps based on U.S. Drought Monitor data and PRISM precipitation data.
These storms provided Marty Ralph—then a researcher at NOAA’s Earth System Research Laboratory in Boulder, Colorado—with the perfect opening act for his workshop presentation. Ralph has his eye constantly fixed on the state of California because he is investigating the processes behind the powerful storms that hit the region. Ralph is now a little closer to the action at the UCSD/Scripps Institution of Oceanography in La Jolla, California.
“More than a decade ago, we started building out a network of observation sites so we could look at the storms that hit the coast of California in more detail,” Ralph says. “What we wanted to know in particular was: what are the conditions that create these certain types of storms that bring extreme rainfall and flooding? We also knew that these findings would be relevant along the rest of the U.S. West Coast.”
Ralph and his colleagues have learned a lot about these extreme storms. They’re just like traditional winter storms in terms of being extratropical cyclones. But trailing along behind and south of the heart of the cyclones, just ahead of the storm’s cold front, a narrow ribbon of moisture forms. This ribbon can grow into a river 400 or more kilometers wide and 2,000 or more kilometers long. The winds winding along this pathway can reach hurricane strength at low altitudes and transport huge amounts of water vapor from the tropics toward the poles.
In mid-February 2014, an intense extratopical storm merged with an atmospheric river and hit the California coast. This three-part animation shows a satellite view of the storm clouds, then a color-coded animation of moisture flowing out of the tropics, and finally, how the atmospheric river banked up against the storm's cold front and moved inland with it. Animation by Dan Pisut, NOAA Environmental Visualization Lab, based on GOES IR imagery from CLASS and total precipitable water data provided by the University of Wisconsin/SSEC MIMIC.
“We refer to them as atmospheric rivers because they are responsible for transporting more than 90 percent of water vapor in the mid-latitudes along these narrow bands,” Ralph explains. “This is all occurring in a very small area that is less than 10 percent of the circumference of the earth.”
The atmospheric rivers off the Pacific Coast may be just one tiny thread in the fabric of our atmosphere, but their storms can pack a big punch. When atmospheric rivers move inland and strike the mountains on the West Coast, the air rises and cools, creating heavy rainfall.
Atmospheric rivers are often called “drought busters” because just one or two storms can help replenish the water system during dry spells. But they can also cause destructive floods and debris flows. Atmospheric rivers are the major driver for flooding events in California. Out of 39 floods in the Russian River region the past 60 years, 34 were related to atmospheric rivers. Sonoma County alone has experienced 32 percent of California’s total repetitive flood losses, the highest in the state.
Ralph and his colleagues’ research has revealed that typical atmospheric river events last about twenty hours at a location on average. But out of the roughly 90 events that they documented from 2004-2010, 10 of them averaged 40 hours in duration—more than twice as long as an average event. These events that “stall” over a certain area produced much more rainfall and seven times as much runoff, causing some of the most damaging floods in the region.
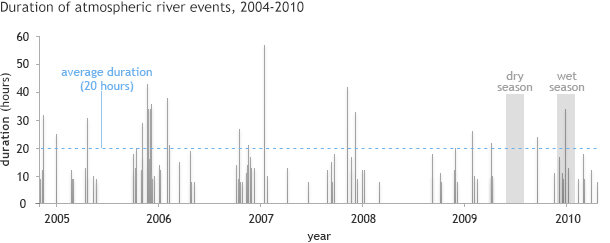
Duration (in hours) of 91 atmospheric river events observed between 2004 and 2010. Events lasted 20 hours on average over coastal locations (blue line), but 12 percent of events exceeded 30 hours in duration. Atmospheric river events take place during the region's "wet season," typically from November through May. NOAA Climate.gov graph adapted from Table 1 in Ralph, Coleman, Neiman, Zamora, Dettinger, 2013.
One of the most recent examples of an atmospheric river gone horribly awry was on December 26, 2005—the day after Christmas. Exceptionally heavy rains hit Northern California that day and peaked on New Year’s Eve. Every stream gauge along the Russian River in Sonoma County registered waters above flood stage. At Guerneville, the hardest-hit town, the river crested more than ten feet above its 32-foot flood stage. The City of Santa Rosa, the water agency’s home base, saw near-record rainfall totaling 17.6 inches.
“The New Year’s Eve flood was the biggest event of the decade, for sure,” Jasperse says, “but we had some even bigger floods in the 60s and in the 80s that could certainly happen again.”
Still, the flood was devastating enough for the Federal Emergency Management Agency to declare it a major disaster. More than 100 roadways were blocked because of flooding and landslides. Some 2,100 business and residential properties were without power. Overall, damages were estimated at $104 million.
The water agency and its infrastructure were hit hard as well. Record peak flows resulted in severe flooding and erosion in the wetlands the agency had designed as a natural barrier to protect Santa Rosa and surrounding areas from flood impacts. Local stormwater systems were overwhelmed, and a local wastewater treatment plant flooded from excessive amounts of water flowing into the facility.
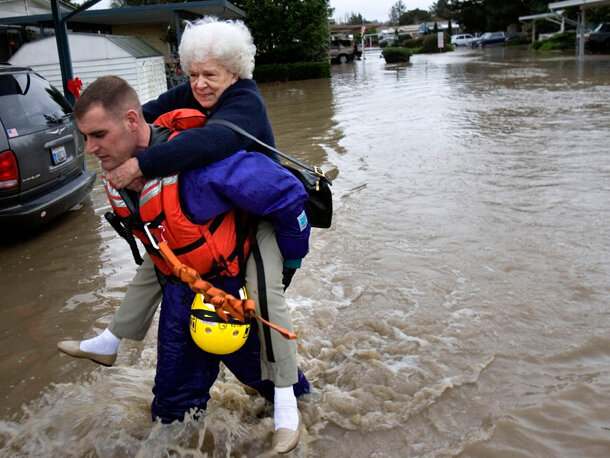
A winter storm caused severe flooding across Northern California in late December 2005, forcing hundreds of people to evacuate. In this photo, firefighter Greg Taylor carries Betty Bakacar from her home in Sonoma County to a waiting truck. Credit: Peter DaSilva, The New York Times.
Water managers are eager for information that can help them monitor extreme storms as they develop and strike the coast. When Ralph met with Jasperse, Delaney, and others at the workshop in 2011, everyone gathered around Ralph’s computer to analyze the streams of data flowing to his computer from observation instruments—stream gauges, wind profilers, rain gauges—located at sites throughout California. Using these tools, everyone could “see” the storm approach Sonoma County in real-time. Jasperse was excited at the prospect of leveraging this information at the water agency.
“The observational data we collect during a storm can even help us process the event after the fact,” Jasperse says. “Precipitation data help us understand the distribution of the rainfall—where it fell and how much. Stream gauges are critical for managing the stream flows within the water system. All of these instruments are key to fulfilling our responsibilities."
Advance warning of these storms would help too. The variable terrain on the coast, which can include both steep hills and canyons, still makes it tough to accurately predict rainfall and floods in the region. Many times, water managers don’t know an atmospheric river is developing until one or two days before the storms hit.
Californians are familiar with scientists’ work on developing earthquake early warning systems; but can they create one for atmospheric river events, too?
Pinning Down the Pineapple Express
We’ve seen the images before: an avalanche of mud enveloping houses on a hillside, rivers cresting over their banks and onto roadways, emergency responders on a boat rescuing families from their front stoops. The ‘Pineapple Express’—the well-known local name for a type of atmospheric river that originates in the Pacific in the general vicinity of Hawaii—has dumped staggering amounts of rainfall and devastation upon the California and Pacific Northwest coast many times in recent decades, including the heavy rains earlier this month that contributed to the tragic landslide in Oso, Washington.
"If you're worried about an extreme event," Ralph says, "you've got to know what you're dealing with. We have to study atmospheric rivers for the benefit of the West Coast, just like how we study tornadoes or hurricanes for other parts of the U.S."
Partners across NOAA, other agencies, and universities have been collecting observations and studying atmospheric rivers in California, including the Russian River Valley region, for more than 10 years now as part of a collaboration called the Hydrometeorology Test Bed, led by NOAA's Water Cycle Branch at the Earth System Research Laboratory.
Now, they’re working with other partners to stand up a statewide observing network that will allow for live monitoring of atmospheric rivers as they strike the coast and penetrate inland. The hope is that this wider observing network will lead to better data to inform new research and improve forecasting products.
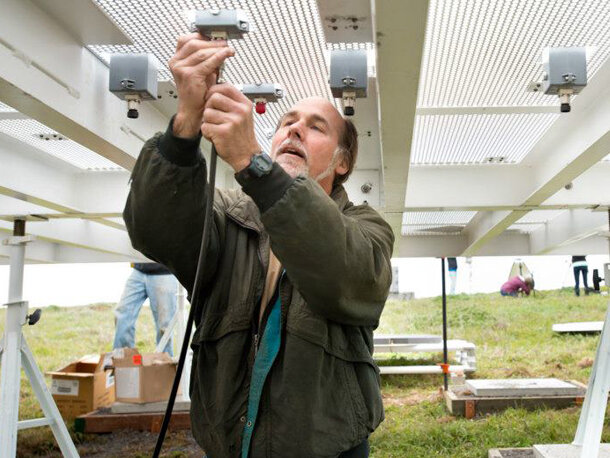
NOAA electronics engineer Tom Ayers prepares to measure the antennas for return loss during the installation of an atmospheric river observatory in Bodega Bay, California, on March 19, 2013. Credit: California Department of Water Resources
The California Department of Water Resources, NOAA, and Scripps are installing more than 30 soil moisture stations around the state, upgrading another 36 earthquake monitoring sites to also measure water vapor concentrations aloft in the atmosphere, and 10 radar units that can track the altitude aloft where snowflakes fall and melt into rain during winter storms—all in real time. They’re also leveraging observation sites that already have been installed by groups in the region.
This wider network will include NOAA’s atmospheric river observatory sites on the California coast. In March 2013, NOAA scientists and colleagues installed the first of four long-term “atmospheric river observatories” at the University of California's Bodega Marine Laboratory in Bodega Bay.
Currently, scientists can see the telltale vapor signature of an incoming atmospheric river from satellite imagery. But they do not have the instruments needed to measure another key factor—strong low-altitude winds that form the core of an atmospheric river, typically centered at 2,000-4,000 feet above sea level. In addition to standard meteorological instruments, the new observatories include Doppler wind-profiling radars that measure the speed and direction of winds at these key altitudes and even higher.
“Normally we don’t measure the winds up to those altitudes,” Ralph says. “Usually we just measure them at the ground and occasionally with balloons. But with wind profilers we can measure them every 100 meters vertically in rain, snow, or clear weather.”
The wind profilers are outfitted with a GPS-met receiver, which measures the total amount of water vapor in the atmosphere every 15 minutes. Combining the water vapor measurement and the wind speeds, Ralph can get an estimate of just how much moisture is moving inland, which largely controls how extreme precipitation will become. Data are updated on an hourly basis, and they are also plugged into a real-time visualization that shows observations over the last 24 hours plus an additional 12 hours of model forecasting into the future. (NOAA’s Atmospheric River Information page provides real-time monitoring and atmospheric river detection.)
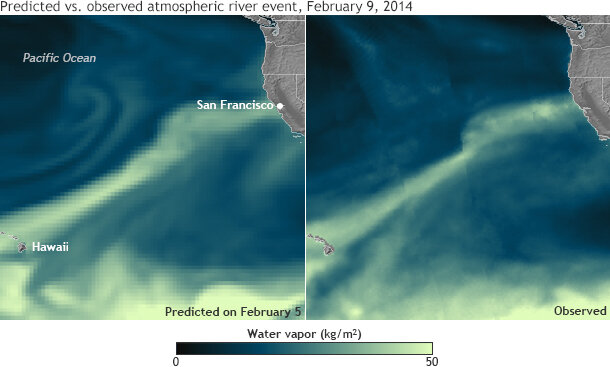
On February 5, forecasts by NOAA (image left) predicted a well-defined atmospheric river would develop in the tropical Pacific and transport moisture into the mid-latitudes near Northern California. Four days later, satellite observations show an atmospheric river hitting the region (image right). While the forecasts were able to signal this event several days ahead of time, the predicted landfall position varied significantly on the scale of several watersheds in California. SSMIS observation data provided by Gary Wick (NOAA) and GFS forecast data obtained from NOMADS courtesy of M. Ralph (Scripps) and J. Cordeira (Plymouth State).
These weather prediction models are starting to show indications of atmospheric river events three to seven days before they strike California.
“But exactly where the storms hit and how strong they will be, how they’re oriented and how long they will last,” Ralph says, “those factors can be very uncertain. We’re trying to better understand that uncertainty so we can pinpoint where the errors are in the forecast.”
Ralph knows that there is a lot of interest in the community for seasonal outlooks. Having a sense of whether there will be a large amount of atmospheric rivers or particularly strong ones in a given year would have tremendous value for water management.
“We’re not quite there yet,” Ralph says. “But we have identified the meteorological conditions that make up these extreme events. That’s key because if you’ve got to have the basic knowledge of these phenomena first before you can focus on predicting their specific traits.”
The Future of Atmospheric Rivers
For long-term planning, knowing how these storms’ characteristics might change in a warmer future is critical. One of Ralph’s colleagues, Mike Dettinger, who works at the Scripps Institution of Oceanography and is with the United States Geological Survey, is researching how the behavior of atmospheric rivers in the region will change in a warmer world.
Dettinger looked at how a range of global climate models simulated atmospheric river events for a future scenario in which global greenhouse gas emissions accelerated throughout the 21st century. Most of models indicated that in the future, the average size of atmospheric river events would not change much but occur somewhat more often.
Furthermore, the most extreme events simulated by the models were even more intense than the most extreme storms we experience today because warming increases evaporation, which puts more water vapor into the atmosphere. Essentially, the models indicate its possible that a new class of stronger atmospheric river events may emerge in a warmer future and contribute to more severe floods in California.
Improving storm monitoring in the region won’t only help with anticipating and preparing for floods. It could also help water managers better manage water supplies when droughts strike the region. It is a delicate task to balance the interests and needs of many different water users when water supplies are low, especially when they include protected fish species—not to mention vineyard owners whose storied roots in this region extend centuries deep.
Stay tuned for Part 2 of this story, “Swapping Feuds for Facts,” which will explore how better forecasting of atmospheric river events and other extremes could ease water conflicts between conservationists and wildlife regulators trying to keep endangered Russian River fish from going extinct and winegrowers trying to keep their industry thriving.
Related Research
Ralph, F. M., Coleman, T., Neiman, P.J., Zamora, R. J., Dettinger, M. D. (2013): Observed Impacts of Duration and Seasonality of Atmospheric-River Landfalls on Soil Moisture and Runoff in Coastal Northern California. J. Hydrometeor, 14, 443–459.
Dettinger, M.D. (2011): Climate change, atmospheric rivers and floods in California—A multimodel analysis of storm frequency and magnitude changes. J. Am. Water Resources Assoc., 47(3), 514-523.
Dettinger, M.D., Ralph, F.M., Das, T., Neiman, P.J., and Cayan, D. (2011): Atmospheric rivers, floods, and the water resources of California. Water, 3 (Special Issue on Managing Water Resources and Development in a Changing Climate), 455-478.
Ralph, F.M., and M.D. Dettinger (2011): Storms, Floods and the Science of Atmospheric Rivers. EOS, Transactions, Amer. Geophys. Union., 92, 265-266.
Ralph, F. M., P. J. Neiman, G. A. Wick, S. I. Gutman, M. D. Dettinger, D. R. Cayan, and A. B. White (2006): Flooding on California's Russian River: Role of atmospheric rivers. Geophys. Res. Lett., 33, L13801.
Related Links
NOAA's Hydrometeorology Testbed
Atmospheric River Information Page. Earth System Research Laboratory.
UCSD/Scripps Institution of Oceanography, Center for Western Weather and Water Extremes - CW3E