2012 State of the Climate: Global Sea Level
Why it’s important
In the United States alone, just under 40 percent of the population lives in coastal areas, where sea level plays a role in flooding and storm hazards, shoreline erosion, and even city water supplies (where seawater seeps into aquifers). Globally, 44 percent of the people on Earth live within 150 kilometers of the shore, and 8 of the 10 largest cities in the world are near the coast, according to the U.N. Atlas of the Oceans. On shorter timescales—seasons to decades—the rise and fall in global sea level reveal the coming and going of natural climate cycles. Over the span of a century or more, changes in sea level are a sign of a warming or cooling climate.
Conditions in 2012
Global average sea level in 2012 was 1.4 inches above the 1993-2010 average, which was the highest yearly average in the satellite record (1993-present). On a yearly basis, differences in sea level from place to place are largely due to shifts in the position or strength of major currents or else due to natural climate patterns that cause regional cooling or warming. (In general, warm waters have a greater volume, and thus higher sea level, than cool waters.)
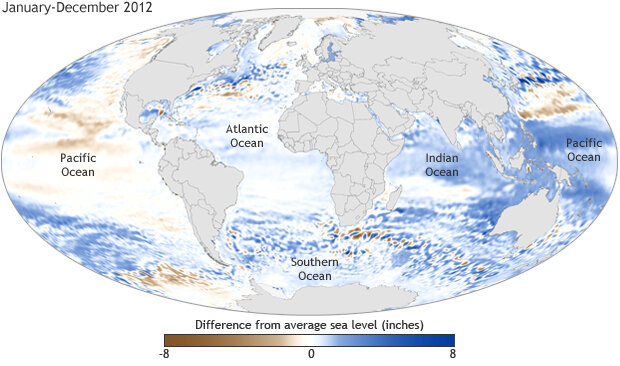
Sea level in 2012 compared to the 1993-2012 average based on AVISO satellite data. Map adapted from Figure 3.27a in the 2012 BAMS State of the Climate Report.
In 2012, lower-than average sea levels around the around the west coast of North America were linked to the cool temperatures associated with the negative phase of the Pacific Decadal Oscillation. The sharp divide in the North Atlantic between areas of above-average and below-average sea level are evidence that the warm waters of the Gulf Stream Current reached farther north than usual.
The higher-than-normal sea levels in the western tropical Pacific and Indian Oceans are an imprint left by the La Nina event that continued from 2011 into the first part of 2012. During La Nina, the trade winds along the equator blow more strongly than normal, pushing warm tropical waters westward across the Pacific. The warm waters “pile up” in the western part of the tropical Pacific, spilling over into the Indian Ocean, making sea levels there higher than average.
Change over time
Sea level has been rising over the past century, and the pace has increased in recent decades. Part of the increase is due to more water being added—meltwater from glaciers and ice sheets—and part of the increase is due to rising water temperatures: water expands in volume when it gets warmer.
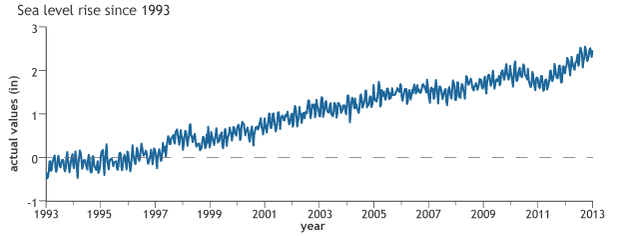
Monthly global sea level from 1993 through early 2013 compared to 1993-2012 average, based on AVISO data. Graph adapted from Figure 2.1(x) in BAMS State of the Climate in 2012.
Since satellite-based global measurements began in 1993, global mean sea level has risen between 2.8 and 3.6 millimeters per year (0.11-0.14 inches/year). In the most recent period (2005–12), meltwater entering the ocean has dominated sea level rise, accounting for more than twice the contribution from warming-caused expansion.
References
M. A. Merrifield, P. Thompson, R. S. Nerem, D. P. Chambers, G. T. Mitchum, M. Menéndez, E. Leuliette, J. J. Marra, W. Sweet, and S. Holgate. [Global Oceans] Sea level variability and change [in “State of the Climate in 2012”]. Bull. Amer. Meteor. Soc., 94 (8),S68-S72.