2014 State of the Climate: Mountain Glaciers
Why glaciers matter
Around the globe, glacier melt provides drinking water for hundreds of millions of people and irrigation water for crops. In some areas, glacial meltwater is the only thing that keeps streams running—and plants and animals hydrated—during hot, dry seasons. In addition, dams on glacier-fed rivers are key sources of hydroelectric power in some parts of the world. Meltwater from glaciers contributes to sea level rise. The retreat and disappearance of mountain glaciers worldwide is one of the clearest signs that global climate is warming over the long term.
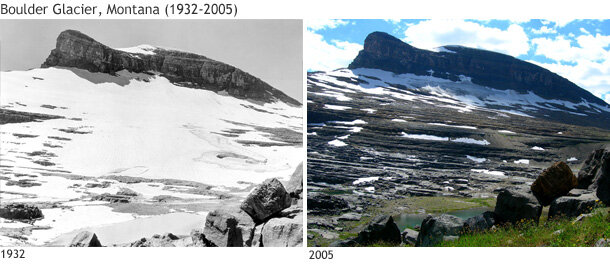
Glacier National Park's Boulder Glacier in 1932 (left) and 2005 (right). Historic photo courtesy T.J. Hileman, Glacier National Park Archives; modern photo by Greg Pederson, U.S. Geological Survey. Both are part of the USGS Repeat Photography gallery.
Conditions in 2014
Glaciers grow by accumulating more snow in the winter than they lose through melt and evaporation in the summer. When snowfall and melt perfectly offset each other, glacier mass is in balance. When melt and evaporation outstrip snow accumulation, the glacier loses mass. As the snowline retreats high up on the glacier, the tip--called the terminus--is exposed to the hot rays of the summer sun. Melting and retreat accelerate.
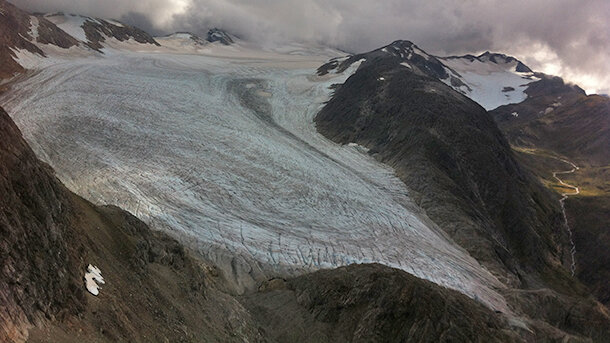
Alaska’s Lemon Creek Glacier in September 2014. Virtually no snow covered the glacier, which exposes the terminus to the Sun and accelerates glacier retreat. This glacier must keep at least 62% of its snow cover to stay in balance. Photo by Chris McNeil, via Mauri Pelto.
In 2014, glaciers continued to shrink. Based on an analysis of more than three dozen reference glaciers with long-term monitoring, the 2014 BAMS State of the Climate reports that in 2014, glaciers experienced an average loss of 853 millimeters of water equivalent, meaning the equivalent depth of water (spread out over the entire glacier area) that would be produced from the amount of melted snow or ice. This loss was not quite as severe the loss from 2013 (887 millimeters), but it still counted among the larger losses recorded since 1980.
Change over time
In assembling data for 2014, the World Glacier Monitoring Service added data for seven new glaciers to the long-term record, and this additional information refined the trend. In prior assessments, 1987 and 1989 showed positive glacier balances. Because of mass balance losses in the newly added glaciers during these years, the most recent year for a positive annual global balance has been pushed back to 1983.
Annual gain or loss in mass for 37 reference glaciers (gray bars) from 1980-2014* and the long-term accumulated loss (red line). Mass is estimated as the depth of water that would result if the melted ice and snow were to spread out across the surface of the glacier. *Data from 2014 are preliminary. NOAA Climate.gov graph adapted from Figure 2.10 in the BAMS State of the Climate in 2014 report.
The rate of glacier mass loss is accelerating. Mean annual glacier losses per decade were −221 millimeters for the 1980s, −389 millimeters for the 1990s, and −726 millimeters for the 2000s. Since 1980, glaciers worldwide have lost a cumulative 16.8 meters of water equivalent. The State of the Climate in 2014 report characterizes this amount as “the equivalent of cutting an 18.5-meter-thick slice off the top of the average glacier.”
Reference
M.S. Pelto, 2015: [Global Climate] Alpine Glaciers [in “State of the Climate in 2014”]. Bulletin of the American Meteorological Society (BAMS), 96 (7), S19-S20.