2023 Arctic Report Card: image highlights
NOAA’s 2023 Arctic Report Card documents new records showing that human-caused warming of the air, ocean and land is affecting people, ecosystems and communities across the Arctic region, which is heating up faster than any other part of the world.
“The overriding message from this year’s report card is that the time for action is now,” said Rick Spinrad, Ph.D., NOAA administrator, in a press release. “NOAA and our federal partners have ramped up our support and collaboration with state, tribal and local communities to help build climate resilience. At the same time, we as a nation and global community must dramatically reduce greenhouse gas emissions that are driving these changes.”
The annual Arctic Report Card, now in its 18th year, is the work of 82 authors from 13 countries. It includes a section titled Vital Signs, that updates eight measures of physical and biological changes, four chapters on emerging issues and a special report on the 2023 summer of extreme wildfires. Below are some image-based highlights from this year's report.
With record-hot summer, Arctic experiences its sixth-warmest year on record
The past year, October 2022–September 2023, was the sixth-warmest year in the Arctic since records began in 1900. It was the 14th consecutive year in which Arctic temperatures exceeded the 1991–2020 average, according to the Arctic Report Card: Update for 2023. (The Arctic monitoring year runs from October of one year to September of the next to span the region’s cold season.)
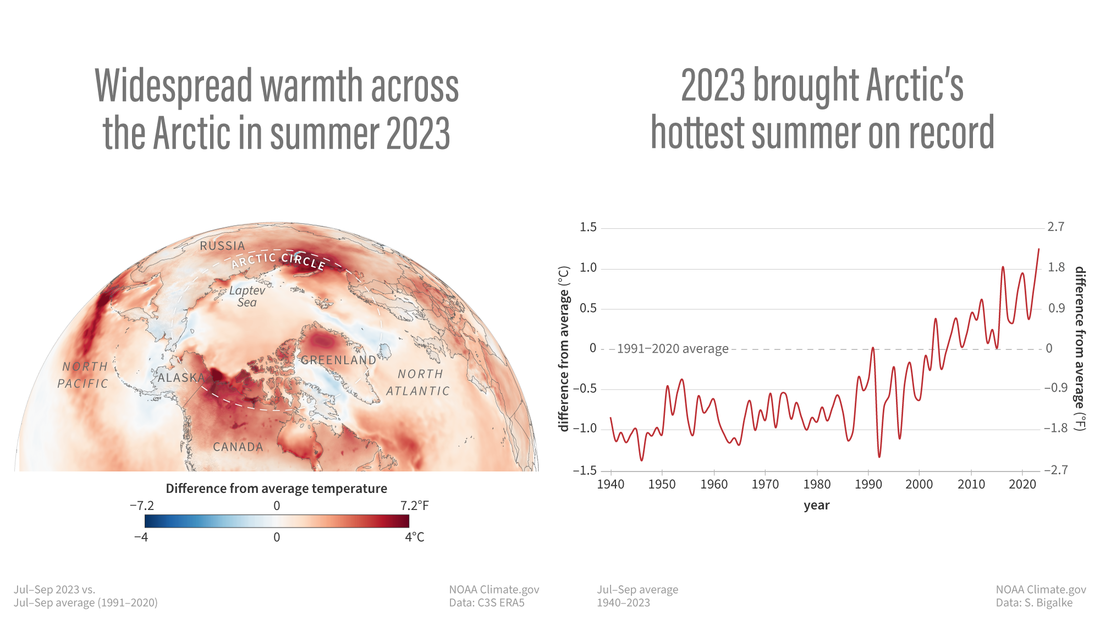
(map) Surface temperatures in July-September 2023 compared to the 1991-2020 average. Some areas were 7.2 degrees Fahrenheit or more above average (darkest red). (graph) Summer temperatures (July-September) each year from 1940-2023, showing rapid warming in recent decades. NOAA Climate.gov image, based on ERA5 data from Siiri Bigalke.
This map shows average surface temperatures in summer (July-September) 2023 compared to the 1991-2020 average. Places where it was warmer or cooler than average are colored red or blue. Intense warmth was present in western North America, northern Greenland, and western Russia. Only a few locations were cooler than average, and none of them strongly so.
The widespread warmth averaged out to a record-warm summer, shown by the graph. Based on ERA5 data from the Copernicus Climate Change group, the graph shows summer temperatures from 1940-2023 compared to the 1991-2020 average. It’s been nearly 20 years since the Arctic experienced a cooler than average summer.
Unusual warmth in northern Canada coincided with below-normal precipitation, contributing to the region’s extreme wildfire season and resulting smoke in the United States. Unusual warmth in Greenland contributed to a cumulative melt-day area approaching the all-time record on the Greenland Ice Sheet.
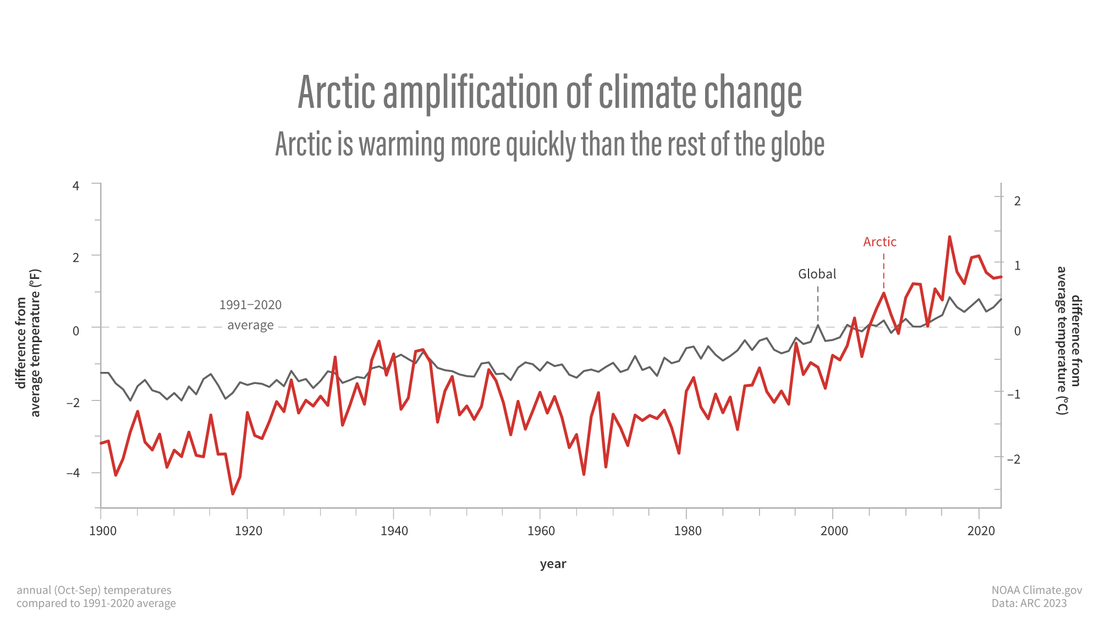
Yearly temperatures in the Arctic (red line) compared to the global average (black line) each year from 1900 to 2023. The Arctic monitoring year runs from October of one year through September of the next to avoid splitting the cold season. The Arctic is warming more quickly than the rest of the planet, a phenomenon known as Arctic amplification of climate change. NOAA Climate.gov image, adapted from 2023 Arctic Report Card.
“Arctic amplification” is a widely recognized phenomenon in which human-caused global warming is amplified at the poles, causing the Arctic to warm more quickly than the rest of the globe. Multiple factors enhance warming at high latitudes, but the main one is that warming reduces snow and ice, which would otherwise reflect incoming sunlight. As this graph indicates, Arctic temperatures have risen at least twice as fast as global temperatures, possibly even faster, since the year 2000. The Arctic’s eight warmest years on record have all occurred since 2016, according to the Arctic Report Card authors.
Reference
Ballinger, T.J., Bigaalke, S., Walsh, J.E., Brettschneider, B.3, Thoman, R.L., Bhatt, U.S., Hanna, E., Hanssen-Bauer, I., Kim,S.-J., Overland, J.E., Wang, M. (2023). Surface air temperature. Arctic Report Card: Update for 2023.
Greening of the Arctic tundra continues with third-highest peak "greenness" since 2000
Although the Arctic tundra is mostly too cold and dry for trees, it’s home to other plants that have evolved to survive the frigid winters and short growing seasons on the Arctic’s coastal plains and foothills. Sandwiched between the boreal forests and the ocean, this area of shrubs, mosses, lichens, grasses, and grass-like plants called sedges grow in the relatively thin layer of soil that thaws out briefly in the Arctic summer. As the Arctic has warmed over the past several decades, satellites have documented a significant “greening” of the tundra according to the 2023 Arctic Report Card.
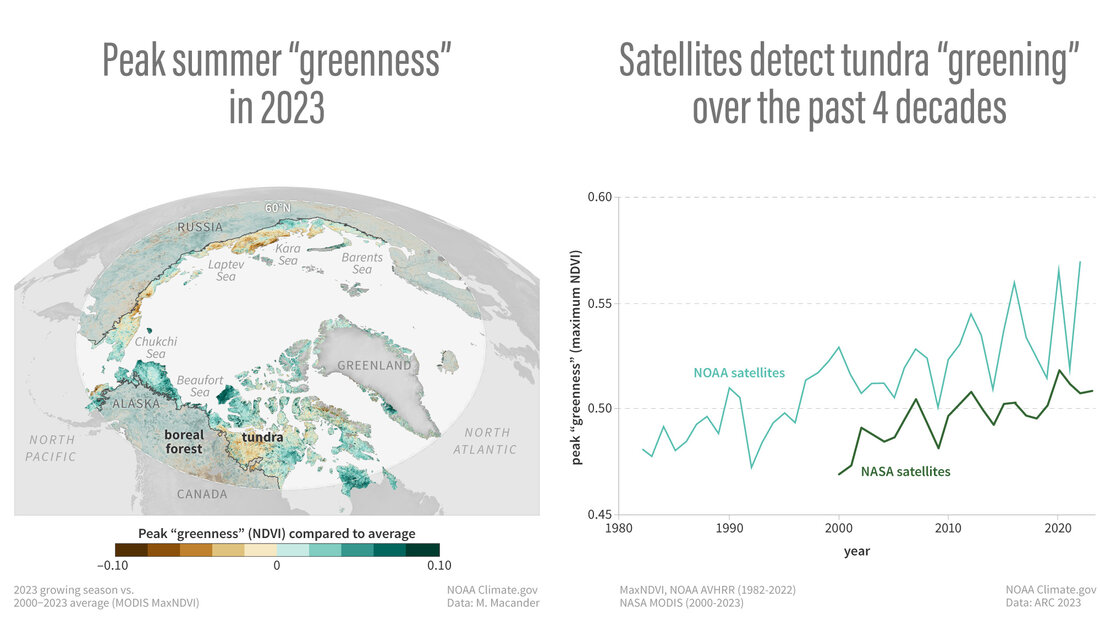
(map) Peak summer "greenness"—a satellite measure of the amount and health of vegetation—was higher than average across the tundra in summer 2023, with especially high values (darkest green) in the North American Arctic. (graph) The peak "greenness" reached each summer in the tundra has increased over time in both NOAA and NASA satellite records. NOAA Climate.gov images, adapted from the 2023 Arctic Report Card and based on data provided by Matt Macander.
This map shows peak summer “greenness” across the Arctic in summer 2023 compared to the long-term average. (“Greenness” is a way to measure vegetation conditions remotely, by observing the unique way vegetation reflects and absorbs different wavelengths of visible and infrared light.) Boreal forest areas have been partially shaded to show the boundary with the tundra. Places where peak greenness was higher than average in 2023 are green; places where it was lower than average are brown. Most of the North American tundra had higher-than-average peak greenness this past summer, while tundra in the Russian Arctic was more mixed.
The graph shows the long-term Arctic greenness trend from NOAA (1982-2022, light green) and NASA (2000-2023, dark green line). Despite significant year-to-year ups and downs, a long-term increase is easy to see. Increases in greeness may reflect healthier or larger plants, but it can also indicate a transition from mosses and lichens to shrubs, sedges, or grasses, as growing seasons become longer and more favorable to larger plants.
Whether these changes in tundra greenness are “good” or “bad” depends on which parts of the human and natural systems you consider. Other factors being equal, better plant growth could help to protect underlying permafrost from thawing, and provide better summer grazing for reindeer and caribou, for example. But increased plant growth may also shade out lichens that provide winter food. It could also mean elevated water demand, drying out the soil and increasing fire risk, as well as reduced reflection of incoming sunlight by snow, accelerating Arctic warming.
Reference
Frost, G.V., Macander, M.J., Bhatt, U.S., Berner, L.T., Bjerke, J.W., Epstein, H.E., Forbes, B.C., Lara, M.J., Magnússon, R.Í., Montesano, P.M., Phoenix, G.K., Serbin, S.P., Tømmervik, H., Waig, C., Walker, D.A., Yang, D. (2023). Tundra greenness. Arctic Report Card: Update for 2023..
Early Arctic snowmelt continues in 2023
The Arctic is warming twice as quickly as the rest of the globe thanks to human-caused global warming, and places that were once snow-covered nearly year round are thawing out earlier in the spring. According to the 2023 Arctic Report Card, winter 2022-23 actually brought above-average snow accumulations to the Arctic, but it disappeared much more quickly in the spring than it used to.
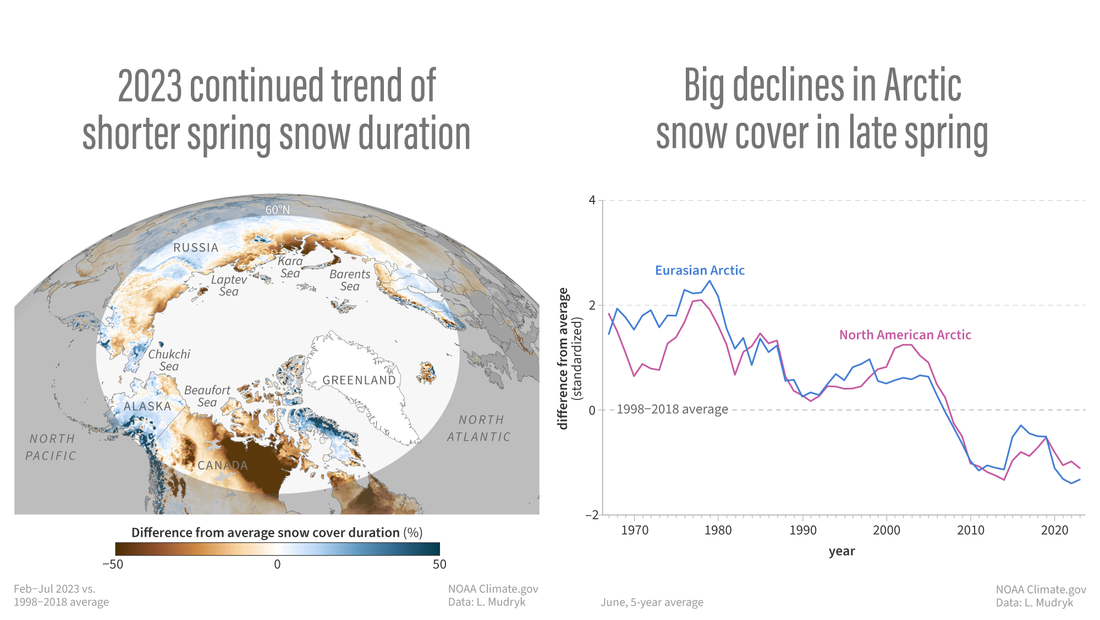
(map) Number of snow-covered days in spring 2023 compared to the 1998–2018 average. (graph) Five-year running average of June snow cover index compared to average since 1967. NOAA Climate.gov image, adapted from 2023 Arctic Report Card.
This map shows the number of snow-free days in the spring and summer of 2023 (total days during February–July) compared to the 1998–2018 average. Areas where snow lasted longer (fewer snow-free days than average) are blue. Areas where snow melted earlier (more snow-free days than average) are brown. Early melt anomalies are conspicuous along the northern edge of Eurasia and, particularly, in eastern North America. According to Arctic Report Card authors, parts of Canada’s mainland Nunavut and Northwest Territories experienced more than a 50 percent increase in springtime snow-free days in 2023.
The early disappearance of snow on the ground in 2023 isn’t an outlier; it’s part of an ongoing, Arctic-wide trend. This graph shows a running five-year average of June snow cover anomalies in the Arctic compared to the 1998-2018 average for that month. In North America (dark pink line), June 2023 snow cover was fourth-lowest for that month in the 56-year record. Eurasian June 2023 snow cover (dark blue line) was ninth-lowest for that month on record. June snow cover has not been above-average for more than a decade and half.
Early snow disappearance can speed up permafrost thaw and vegetation green-up, dry out the soil and increase fire risk, and weaken camouflage for animals whose fur or feathers change color with the seasons.
Reference
Mudryk, L., Elias Chereque, A., Derksen, C., Luojus, K., Decharme, B. (2023). Terrestrial snow cover. Arctic Report Card: Update for 2023.
Peatland restoration in Finland is a nature-based climate solution led by traditional knowledge
Many of the solutions to climate change will require advanced technology and engineering. But we can also look to nature itself for solutions, and in many cases, these nature-based solutions have additional benefits, including safeguarding biodiversity and preserving Indigenous, rural, and other unique cultural traditions. The 2023 Arctic Report Card includes an essay about one of these nature-based climate solutions: the rewilding of degraded forests and peatlands in Finland.
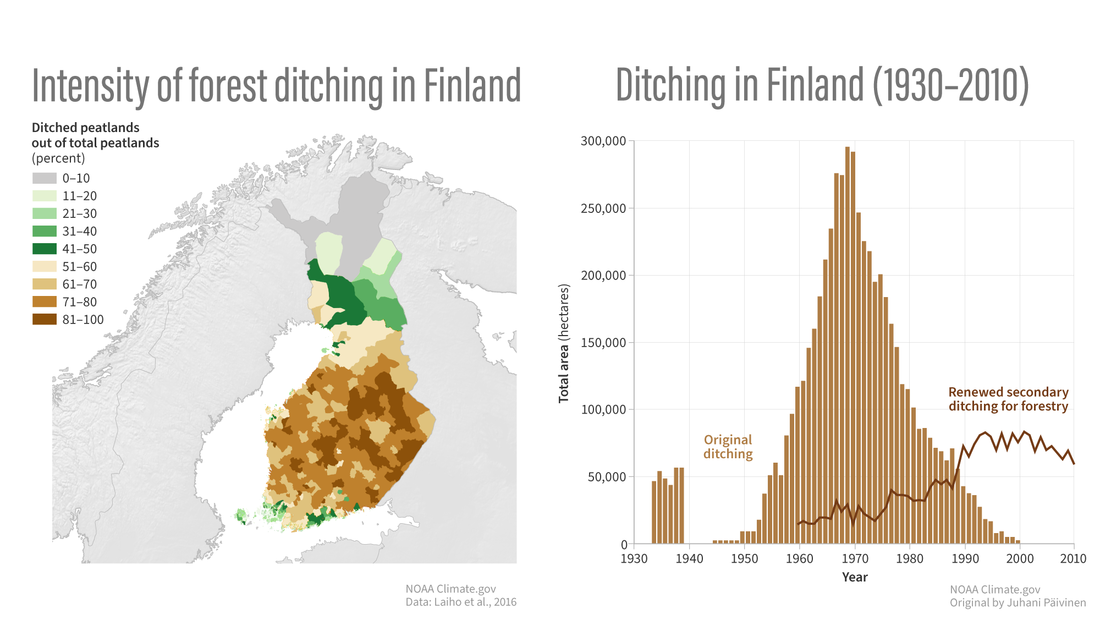
(map) Intensity of ditching in Finland provinces. (graph) Total peatland area undergoing first or secondary ditching over the 20th century, with an interruption during World War 2. NOAA Climate.gov image, adapted from 2023 Arctic Report Card.
This map shows the scale of the challenge, but also the great possibility for restoration: across most of central and southern Finland, more than half of forest peatlands have been ditched for drainage (brown colors). In many provinces, the rate of ditching is as high as 75-100 percent. In the 2023 Arctic Report Card, authors describe multiple waves of commercial exploitation of boreal forests and peatlands in Finland beginning in the 1600s, both for the timber and the peat itself, which can be burned for heating. The graph shows the total area that underwent original ditching (brown bars) or secondary ditching (brown line) each year beginning in the 1930s (interrupted by World War 2).
Frozen in the winter, and soggy through the summer, intact Arctic peatlands are among the largest natural storehouses of carbon on land. Vegetation dies but decays very, very slowly, building up into deep layers of peat. But when they are dried out or otherwise degraded, microbes and fungi begin to digest the vegetation, returning carbon dioxide to the air. The authors of the essay describe the way that commercial exploitation of Finland’s peat lands led to both ecological and cultural degradation, including loss of Indigenous and community rights and traditions of the Sami, the only Indigenous peoples of mainland Europe.
But the authors also report on efforts that began in 2017 to use rewilding of some of Finland’s peatlands as a chance to implement a nature-based solution to climate change that also empowers local community-conserved areas (CCA)s and respects Indigenous rights and traditional knowledge. To date, the Snowchange Cooperative, a partnership among Indigenous and traditional community leaders, nonprofits, scientists, and investors, has rewilded and restored forests and peatlands that positively influence 52,000 hectares, beginning with processes like blocking ditches and re-creating the wetlands that are the foundation of the recovering peatlands.
In addition to slowing carbon losses, the restoration in one large wetland complex has brought more than 200 species of birds back to an area where the number had previously dwindled to 4-6 and returned a spawning rare/critically endangered (CR) trout population to a previously damaged stream.
To learn more about peatland restoration activities in Finland, see the 2023 Arctic Report Card essay Peatlands and associated boreal forests of Finland under restoration.
Reference
Mustonen, T. (2023). Peatlands and associated boreal forests of Finland under restoration. Arctic Report Card: Update for 2023.
Arctic seas are in a feedback loop: summer warming reduces sea ice, which causes more warming
The shallow seas around the margins of the Arctic Ocean have warmed dramatically in the past four decades according to NOAA’s 2023 Arctic Report Card. On average, these areas have warmed around 2 degrees C (nearly 4 degrees F) over the satellite era, part of a feedback loop in which warming air and water temperatures shrink the sea ice cover, which exposes more of the ocean to direct sunlight, which drives more warming.
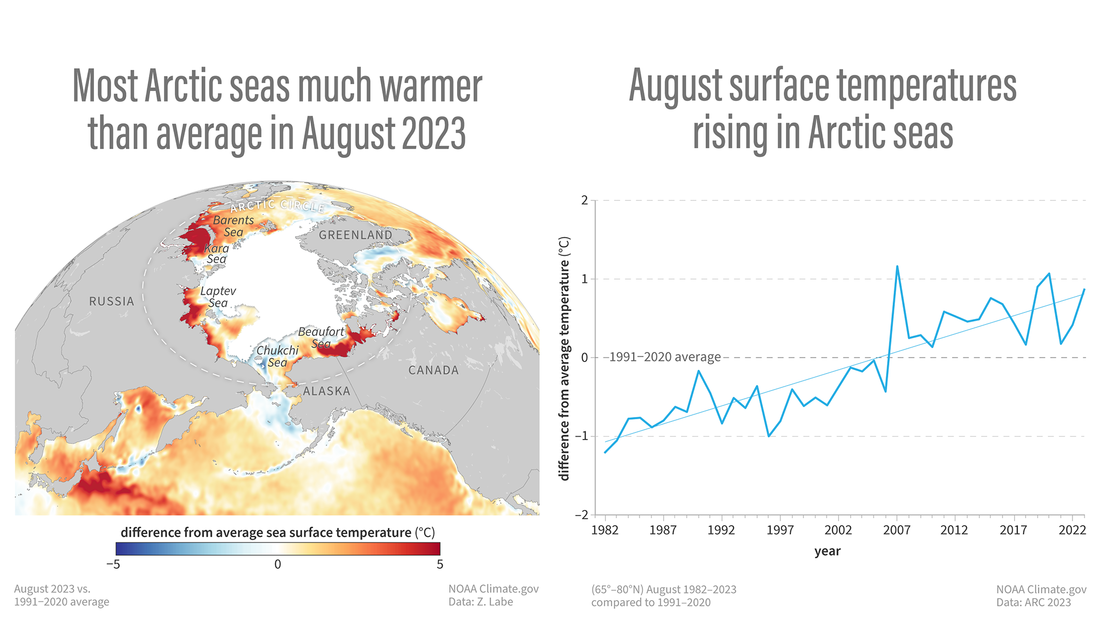
(map) Sea surface temperature in ice-free Arctic seas in August 2023 compared to the 1991-2020 average, with places that were warmer than average colored yellow, orange, or red, and places that were cooler than average colored blue. (graph) Average August sea surface temperature for all Arctic seas between 65 and 90 ˚N. NOAA Climate.gov image, adapted from the 2023 Arctic Report Card and based on data provided by Zachary Labe.
This map shows sea surface temperatures in August 2023 compared to the 1991-2020 average. The solid white area is the August sea ice extent—the area where sea ice concentration is at least 15 percent. Red areas were up to 5 degrees Celsius (9 degrees Fahrenheit) or more above average, with intense warm anomalies in the Barents and Laptev Seas of the Eurasian Arctic and in the Beaufort Sea on the North American side of the Arctic.
The graph shows August average sea surface temperatures in the Arctic Ocean compared to the 1991-2020 average for each year since the start of the satellite record in 1982. Despite year to year ups and downs, there is a clear upward trend. It’s been a decade and a half since summer sea surface temperatures have been cooler than average in the Arctic.
Higher water temperatures in August lead to greater ocean heat storage and to delayed fall ice freeze up. Lack of sea ice can put stress on polar bears and other marine mammals that require the ice for habitat and on the Arctic communities that depend on marine life. The delay in ice formation can also increase Arctic communities’ exposure to pounding surf during fall and winter storms.
Reference
Timmermans, M.-L., and Labe, Z. (2023). Sea surface temperature. Arctic Report Card: Update for 2023.
Long-term sea ice declines continue in 2023
Every year, sea ice grows throughout the fall and winter, and melts throughout the spring and summer. Arctic sea ice extent—the area of ocean covered by at least 15 percent sea ice concentration—typically reaches its maximum in March and minimum in September. Neither the March nor September Arctic sea ice extent was a record low in 2023, but both monthly average extents continued the long-term downward trend, according to the Arctic Report Card: Update for 2023. The Arctic September minimum was the sixth-lowest in the satellite record since 1979, and the lowest 17 extents in the 45-year satellite record have all occurred in the last 17 years.
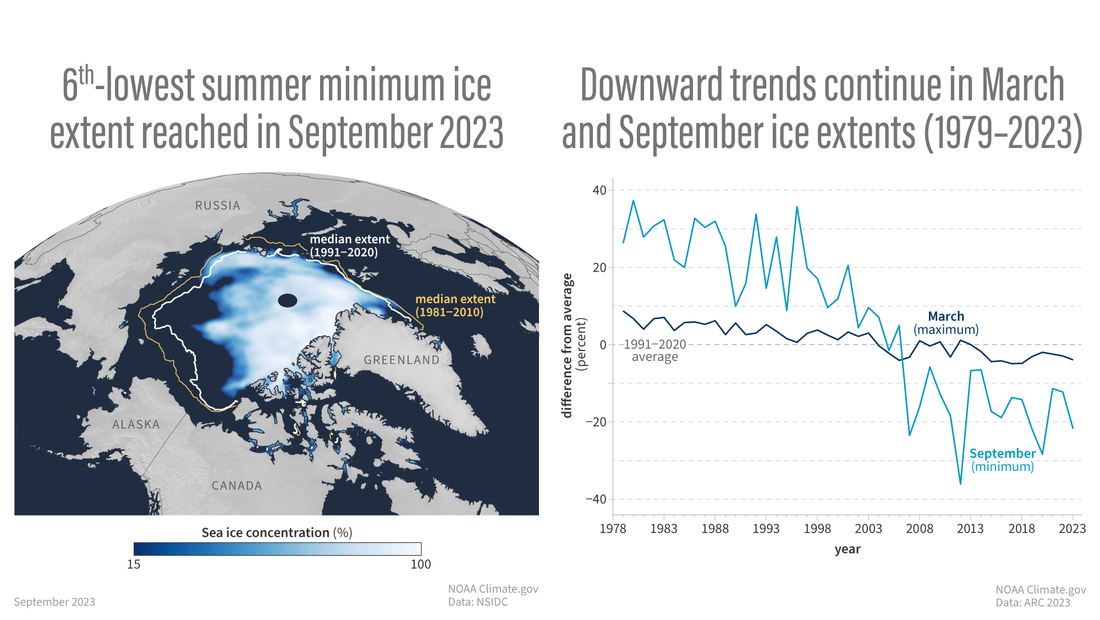
(map) Ice extent (the area where ice concentration is at least 15%) in September 2023 compared to the 1991-2020 median extent (white line) and the 1981-2010 median extent (gold line). (graph) Yearly ice extents in March (the winter maximum) and September (the summer minimum) each year since 1979. NOAA Climate.gov image, adapted from the 2023 Arctic Report Card and based on data from the National Snow and Ice Data Center.
This map shows monthly sea ice concentration for September 2023. Higher concentrations are in white or very light blue, and lower concentrations are in darker shades of blue. For comparison, two monthly median extent lines appear. (Median refers to the middle of the historical record, with half the years showing larger extents and half the years showing smaller extents.) The 1991–2020 median, used by NOAA and the Arctic Report Card, appears in white. The 1981–2010 median, used by the National Snow and Ice Data Center Sea Ice Index, appears in gold. Compared to both median lines, 2023 sea ice extent is especially low north of Alaska and eastern Russia. Arctic Report Card authors highlighted rapid ice retreat in these regions in August 2023. By September 2023, authors reported, the Northwest Passage was relatively ice-free, except for some blockage in its western reaches, and the Northern Sea Route along the Russian coast opened completely.
The graph shows monthly extent anomalies, compared to the 1991–2020 average, for both the March maximum and the September minimum. The long-term decline is much more pronounced in September, but both months show a declining trend over the course of the satellite record.
Reference
Meier, W.N., Petty, A., Hendricks, S., Kaleschke, L., Divine, D., Farrell, S., Gerland, S., Perovich, D., Ricker, R., Tian-Kunze, S., Webster, M. (2023). Sea ice. Arctic Report Card: Update for 2023.