Climate change: atmospheric carbon dioxide
Carbon dioxide levels in 2024
Based on the annual analysis from NOAA’s Global Monitoring Lab, global average atmospheric carbon dioxide was 422.8 parts per million (“ppm,” for short) in 2024, a new record high. The increase during 2024 was 3.75 ppm—the largest one-year increase on record. At Mauna Loa Observatory in Hawaii (graph above), where the modern carbon dioxide record began in 1958, the annual average carbon dioxide in 2024 was 424.61 ppm, also a new record.
The years with the largest annual carbon dioxide growth tend to be associated with the strongest El Niños—the warm phase of a natural climate pattern in the tropical Pacific—which lead to high temperatures over land and sea and an expansion of global drought area. In turn, these weather conditions typically lead to less plant growth, which reduces carbon dioxide uptake, as well as increased decomposition of carbon in soil and increased carbon dioxide emissions from forest fires. Together, these impacts cause atmospheric carbon dioxide levels to rise faster than normal.
Even though the 2023-24 El Niño had waned by April, record high air temperatures and drought in all of 2024, similar to those during an El Nino, were likely drivers of the large increase in atmospheric carbon dioxide in 2024. In addition to other factors, large forest fires in both the Amazon and Canada contributed to the 2024 global increase.
Fossil fuels overwhelm Earth’s natural carbon cycle
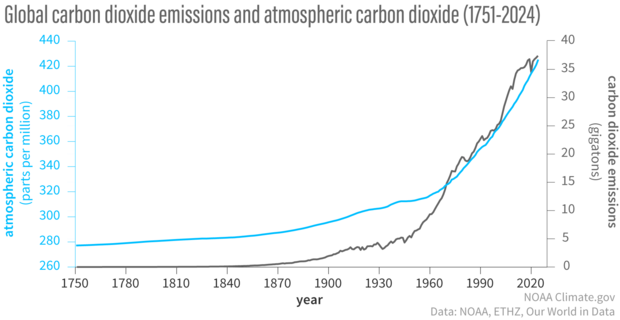
Carbon dioxide concentrations are rising mostly because of the fossil fuels that people have been burning for energy since the start of the Industrial Revolution. Fossil fuels like coal and oil contain the carbon from millions of years of photosynthesis—the process by which plants remove carbon dioxide from the atmosphere. We are returning that carbon to the atmosphere in just a few hundred years. Since the middle of the 20th century, annual emissions of carbon dioxide from burning fossil fuels have increased every decade, from close to 11 billion tons of carbon dioxide per year in the 1960s to an estimated 37.4 billion tons in 2024 according to the Global Carbon Budget 2024.
The amount of carbon dioxide in the atmosphere (blue line) has increased along with human emissions (gray line) since the start of the Industrial Revolution in 1750. Emissions rose slowly to about 5 gigatons (1 gigaton is 1 billion metric tons per year) in the mid-20th century before rapidly increasing to more than 35 billion tons per year by the end of the century. NOAA Climate.gov graph, adapted from original by Dr. Howard Diamond (NOAA ARL). Atmospheric carbon dioxide data from NOAA and ETHZ. Carbon dioxide emissions data from Our World in Data and the Global Carbon Project.
Carbon cycle experts estimate that natural “sinks,” including plant growth and ocean absorption, remove about half of carbon dioxide humans emit into the atmosphere from fossil fuel burning. The rest stays in the atmosphere. Every year, we are adding more carbon dioxide to the atmosphere than natural sinks can remove, and so the total amount of carbon dioxide in the atmosphere goes up. The bigger the overshoot, the faster atmospheric carbon dioxide increases.
In the 1960s, atmospheric carbon dioxide increased by about 0.8 ppm per year on average. That growth rate doubled to an average of 1.6 ppm per year in the 1980s and 1.5 ppm per year in the 1990s. In the last decade (2015-2024), the annual increase has accelerated to 2.6 ppm per year. As a result, the annual rate of increase in atmospheric carbon dioxide over the past 60 years is 100-200 times faster than the increase that occurred at the end of the last ice age 11,000-17,000 years ago.
Why carbon dioxide matters
Carbon dioxide is Earth’s most important long-lived greenhouse gas: a gas that absorbs and radiates heat. Unlike oxygen or nitrogen (which make up most of Earth's atmosphere), greenhouse gases absorb heat radiating from the Earth’s surface and re-release it in all directions—including back toward Earth’s surface. Without any carbon dioxide, Earth’s natural greenhouse effect would be too weak to keep the average global surface temperature above freezing.
By adding more carbon dioxide to the atmosphere, people are amplifying the natural greenhouse effect, causing global temperature to rise. According to observations and analysis by the NOAA Global Monitoring Laboratory, carbon dioxide alone is responsible for about 80 percent of the total heating influence of all human-produced greenhouse gases since 1990.
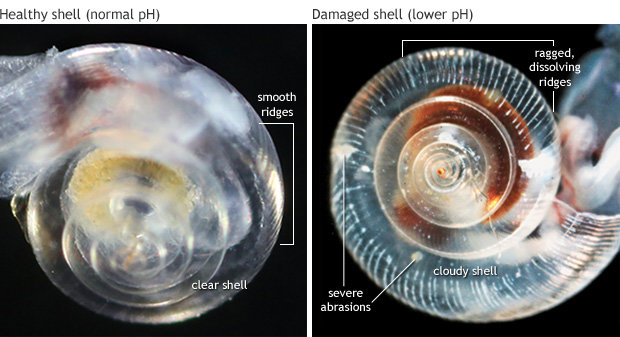
Another reason carbon dioxide is important in the Earth system is that it dissolves into the ocean like the fizz in a can of soda. It reacts with water molecules, producing carbonic acid and lowering the ocean's pH (raising its acidity). Since the start of the Industrial Revolution, the pH of the ocean's surface waters has dropped from 8.21 to 8.10. This drop in pH is called ocean acidification, and it interferes with the ability of marine life to extract calcium from sea water to build skeletons and shells.
(left) A healthy ocean snail has a transparent shell with smoothly contoured ridges. (right) A shell exposed to more acidic, corrosive waters is cloudy, ragged, and pockmarked with ‘kinks’ and weak spots. Photos courtesy Nina Bednarsek, NOAA PMEL.
Past and future carbon dioxide
Natural increases in carbon dioxide concentrations have periodically warmed Earth’s temperature during ice age cycles over the past million years or more. The warm episodes (interglacials) began with a small increase in incoming sunlight in the Northern Hemisphere summer due to variations in Earth’s orbit around the Sun and its axis of rotation. (For more details, see the “Milankovitch cycles and ice ages” section of our Climate change: incoming sunlight article.)
That little bit of extra sunlight caused a little bit of warming. As the oceans warmed, they outgassed carbon dioxide—like a can of soda going flat in the heat of a summer day. The extra carbon dioxide in the atmosphere greatly amplified the initial, solar-driven warming.
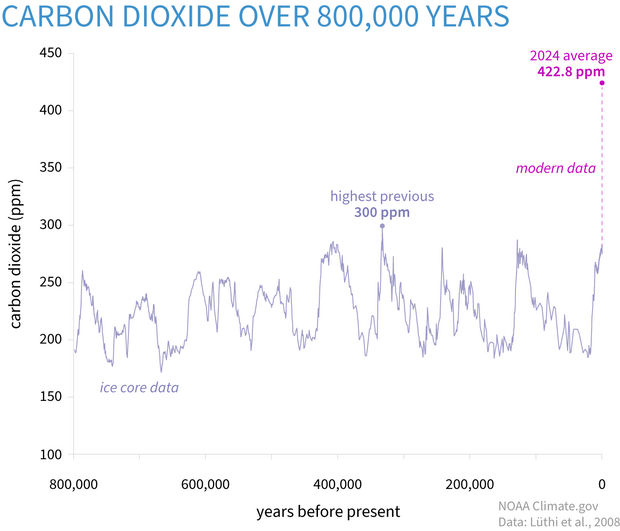
Based on air bubbles trapped in mile-thick ice cores and other paleoclimate evidence, we know that during the ice age cycles of the past million years or so, atmospheric carbon dioxide didn't get any higher than 300 ppm. Before the Industrial Revolution started in the mid-1700s, atmospheric carbon dioxide was 280 ppm or less.
Atmospheric carbon dioxide (CO2) in parts per million (ppm) for the past 800,000 years based on ice-core data (light purple line) compared to 2024 concentrations (bright magenta dot). The peaks and valleys in the line show ice ages (low CO2) and warmer interglacials (higher CO2). Throughout that time, CO2 was never higher than 300 ppm (light purple dot, between 300,000 and 400,000 years ago). The increase over the last 60 years is 100 times faster than previous natural increases. In fact, on the geologic time scale, the increase from the end of the last ice age to the present value of 422.8 ppm (dashed magenta line) looks virtually instantaneous. Graph by NOAA Climate.gov based on data from Lüthi, et al., 2008, via NOAA NCEI Paleoclimatology Program.
By the time continuous observations began at Mauna Loa Volcanic Observatory in 1958, global atmospheric carbon dioxide was already 315 ppm. Carbon dioxide levels today are higher than at any point in human history. In fact, the last time atmospheric carbon dioxide amounts were this high was roughly 3 million years ago, during the Mid-Pliocene Warm Period, when global surface temperature was 4.5–7.2 degrees Fahrenheit (2.5–4 degrees Celsius) warmer than during the pre-industrial era. Sea level was at least 16 feet higher than it was in 1900 and possibly as much as 82 feet higher.
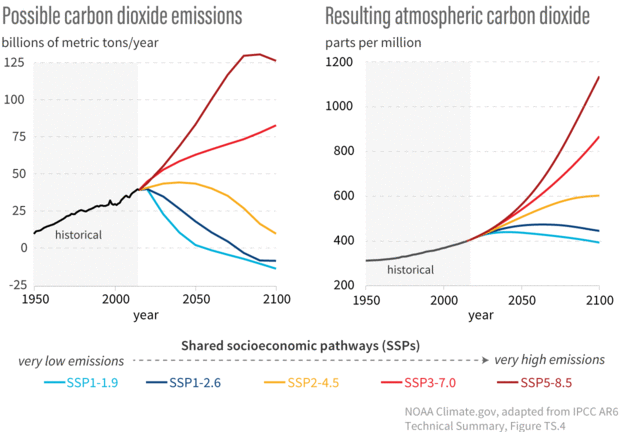
If global energy demand continues to grow rapidly and we meet it mostly with fossil fuels, human emissions of carbon dioxide could reach 75 billion tons per year or more by the end of the century. Atmospheric carbon dioxide amounts could be 800 ppm or higher—conditions not seen on Earth for close to 50 million years.
Possible future pathways for yearly global carbon dioxide emissions (left) and the resulting atmospheric carbon dioxide concentrations (right) through the end of the century. These possible futures are based on different shared socioeconomic pathways ("SSPs" for short). Each pathway is an internally consistent set of assumptions about future population growth, global and regional economic activity, and technological advances. Climate models use the pathways to project a range of possible future atmospheric carbon dioxide amounts; for simplicity, the image shows the only the mean value predicted by the models for each pathway, not the full range of uncertainty. NOAA Climate.gov graphic adapted from figure TS.4 in the IPCC Sixth Assessment Report Technical Summary.
More on carbon dioxide
NOAA carbon dioxide observations
Carbon dioxide emissions by country over time
Comparing greenhouse gases by their global warming potential
References
Collins, M., R. Knutti, J. Arblaster, J.-L. Dufresne, T. Fichefet, P. Friedlingstein, X. Gao, W.J. Gutowski, T. Johns, G. Krinner, M. Shongwe, C. Tebaldi, A.J. Weaver and M. Wehner, 2013: Long-term Climate Change: Projections, Commitments and Irreversibility. In: Climate Change 2013: The Physical Science Basis. Contribution of Working Group I to the Fifth Assessment Report of the Intergovernmental Panel on Climate Change [Stocker, T.F., D. Qin, G.-K. Plattner, M. Tignor, S.K. Allen, J. Boschung, A. Nauels, Y. Xia, V. Bex and P.M. Midgley (eds.)]. Cambridge University Press, Cambridge, United Kingdom and New York, NY, USA.
Friedlingstein, P., O’Sullivan, M., Jones, M. W., Andrew, R. M., Gregor, L., Hauck, J., Le Quéré, C., Luijkx, I. T., Olsen, A., Peters, G. P., Peters, W., Pongratz, J., Schwingshackl, C., Sitch, S., Canadell, J. G., Ciais, P., Jackson, R. B., Alin, S. R., Alkama, R., … Zheng, B. (2022). Global Carbon Budget 2022. Earth System Science Data, 14(11), 4811–4900. https://doi.org/10.5194/essd-14-4811-2022
Lan, X., B. D. Hall, G. Dutton, J. Mühle, J. W. Elkins, and I. J. Vimont. (2022). Long-lived greenhouses gases [in State of the Climate in 2021, Chapter 2: Global Climate]. Bulletin of the American Meteorological Society, 103 (8), S81-S84. https://doi.org/10.1175/BAMS-D-22-0092.1.
Lüthi, D., M. Le Floch, B. Bereiter, T. Blunier, J.-M. Barnola, U. Siegenthaler, D. Raynaud, J. Jouzel, H. Fischer, K. Kawamura, and T.F. Stocker. (2008). High-resolution carbon dioxide concentration record 650,000-800,000 years before present. Nature, Vol. 453, pp. 379-382. doi:10.1038/nature06949.
NOAA Global Monitoring Lab. (2024). The NOAA Annual Greenhouse Gas Index. Accessed May 8, 2025.
Woods Hole Oceanographic Institution. (2015). Introduction to ocean acidification. Accessed October 4, 2017.
Lindsey, R. (2009). Climate and Earth’s energy budget. Accessed October 4, 2017.


