Global climate summary for August 2024
Highlights
- Temperatures were above average over much of the globe, with Europe having its warmest August on record.
- The year-to-date global temperature was the warmest such period on record, with South America, Europe and Africa each ranking first.
- Northern Hemisphere snow cover extent was near average in August whereas global sea ice extent ranked second lowest on record.
- Global tropical cyclone activity was near average with 15 named storms, including two in the Atlantic Basin.
- According to NCEI’s Global Annual Temperature Outlook, there is a 97% chance that 2024 will rank as the warmest year on record.
August temperature
The August global surface temperature was 1.27°C (2.29°F) above the 20th-century average of 15.6°C (60.1°F), making it the warmest August on record. This was 0.01°C (0.02°F) above the previous August record set last year, and the 15th consecutive month of record-high global temperatures. August 2024 marked the 46th consecutive August (since 1979) with temperatures at least nominally above the 20th-century average.
There have been 15 consecutive months of record-hot global temperatures, spanning from June 2023 through August 2024. This breaks the previous record (May 2015 through May 2016) for longest record-warm global temperature streak in modern record (since 1980). Each month of record global temperatures, compared to the 1991-2020 average, is shown in sequence. Places that were warmer than average are red; places that were cooler than average are blue. Image by NOAA Climate.gov, based on data from NOAA National Centers for Environmental Information.
It was the second warmest August for global ocean surface temperatures. These temperatures occurred under ENSO-neutral conditions. According to NOAA's Climate Prediction Center, La Niña conditions are expected to emerge in September-November (71% chance) and should persist through January-March 2025.
The Northern Hemisphere had its second-warmest August on record at 1.48°C (2.66°F) above average. The Northern Hemisphere land temperature also was second-warmest for August as was the ocean temperature. These were all slightly cooler than the record warm Northern Hemisphere in August 2023. The Arctic region had its fourth-warmest August on record.
August 2024 in the Southern Hemisphere ranked warmest on record at 1.06°C (1.91°F) above average. The ocean-only temperature for August in the Southern Hemisphere ranked second-highest on record, while the land-only Southern Hemisphere temperature was warmest on record. Meanwhile, the Antarctic region had its second-warmest August on record, 1.85°C (3.33°F) above average, and Antarctic sea ice extent was second lowest on record for August.
Seasonal temperature: June through August 2024
The June 2024–August 2024 global surface temperature was the warmest June–August period in the 175-year record, 1.24°C (2.23°F) above the 20th-century average of 15.6°C (60.1°F). The past eleven June–August seasons have been the warmest such periods on record.
Interactive graph showing global temperature each June-August from 1850-2024 compared to the 20th-century average. Use your cursor and hover over a specific year or bar to examine individual years more closely. Warmer-than-average years are red; cooler-than-average years are blue. Image by NOAA Climate.gov, based on data from NOAA National Centers for Environmental Information, created with Datawrapper.
The June–August period is defined as the Northern Hemisphere's meteorological summer and the Southern Hemisphere's meteorological winter. The Northern Hemisphere summer 2024 temperature was the warmest on record, and marks the 46th consecutive summer with global temperatures nominally above the 20th-century average in the Northern Hemisphere. The Southern Hemisphere winter temperature also ranked warmest on record, and marks the 54th consecutive winter that was at least nominally warmer-than-average in the Southern Hemisphere.
Over the land surface, air temperatures for the season were record warm across much of Africa, eastern Europe, southwest Asia, central and southeast Asia, parts of southern Australia, and large parts of Brazil. Record warm June–August temperatures also occurred in many parts of the Arctic and Antarctic. Elsewhere seasonal temperatures were much above average across much of North America, except most notably in the central U.S. and western Alaska. Temperatures also were much above average or record warm in most of Greenland and northern parts of Scandinavia.
In contrast to the widespread anomalous warmth and record-warm temperatures, areas with near-average to cooler-than-average temperatures were generally confined to the southern third of South America, a small part of eastern Antarctica, and eastern parts of the Russian Far East and western Alaska.
Sea surface temperatures for the June–August period were record warm across large parts of the Atlantic Ocean and Caribbean, the central and northern Indian Ocean, many parts of the western Pacific, and parts of the Southern Ocean. Areas with seasonal sea surface temperatures cooler than the 1991–2020 average included the southeastern Pacific Ocean, parts of the southern Atlantic, the North Atlantic, and a small part of the southwest Indian Ocean.
August precipitation from land-based stations
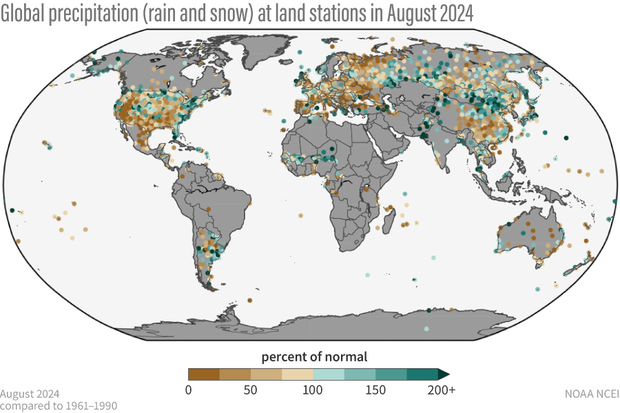
Percent of normal precipitation for global land-based stations in August 2024 compared to a baseline of 1961–1990. Places that received more than 100 percent of their average August precipitation are colored green; places that received less than 100 percent of their average August precipitation are colored brown. Gray areas represent missing data. Image by NOAA Climate.gov, based on data from NOAA National Centers for Environmental Information.
August was drier-than-average across much of Europe, the Mediterranean and parts of North Africa. Other areas with below-average precipitation included large parts of the U.S., Mexico, much of Argentina and large parts of the eastern half of Russia, central and southern China, and much of southern and central Australia. Areas most notably wetter than average included areas affected by tropical systems, such as the southeastern U.S., parts of northwest India and southeast Pakistan, and parts of Japan. Other notable areas of above-average precipitation included southern areas of the West Africa Sahel, northeastern China and eastern Mongolia, central Asia, southern Bangladesh, parts of central Argentina, and much of central and western Alaska.
For information on 2024's year-to-date temperature ranking, notable climate events, and separate statistics for Earth's land and ocean areas see the full August 2024 monthly report from NOAA NCEI.
Satellite summary for global precipitation patterns for August
Headlines
- After a hot Northern Hemisphere summer, global precipitation for August remained just above average.
- The tropical rainfall anomaly pattern for August shifted slightly towards a La Niña-like pattern.
- Tropical cyclone tracks were evident in the Pacific (even Hawaii) and along the U.S. east coast (with Hurricane Debby), although the rest of the Atlantic was quiet.
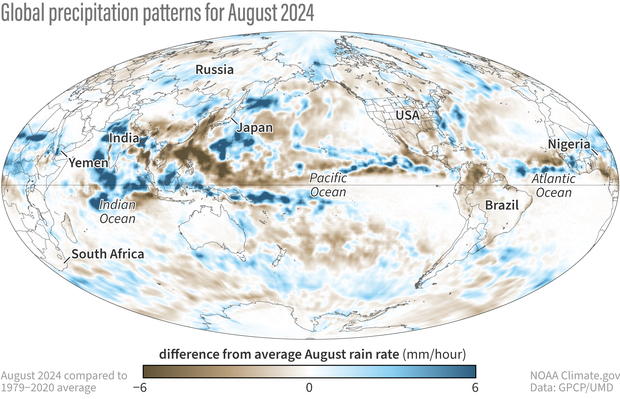
Precipitation around the world in August 2024 compared to the 1979-2020 average. Places that received more precipitation than average are colored blue; places that received less precipitation than average are colored brown. Map by NOAA Climate.gov, based on data provided by the Global Precipitation Climatology Project (University of Maryland).
August 2024 was again a very hot month in terms of mean global surface temperature, with this June-August period setting a global heat record. The global precipitation average also remained slightly above the August average, and as the El Niño to La Niña transition slowly continued, the tropical rainfall anomaly [difference from the long-term average] pattern began to resemble a more La Niña-like pattern.
The mean precipitation analysis for August has the Asian monsoon with its usual swath of heavy rain across South Asia and also very intense Atlantic and Pacific ITCZs [Intertropical Convergence Zones], along with the subtropical dry zones. The anomaly map [shown above] for the month has intense positive anomalies over parts of the Indian sub-continent and surrounding waters and eastward through Southeast Asia and Indonesia and out into the Pacific. To the north of that feature and roughly parallel to that feature, a dry zone is evident. The dry anomaly dominates in the mid-Pacific along the equator, although weakly. These features indicate a slightly larger La Niña effect on the precipitation patterns this month as one might expect with the Niño 3.4 SST [sea surface temperature] index ending up slightly negative at the end of August.
Some of these positive anomalies were associated with flooding and landslide events in Bangladesh and northeast India (100 dead) and tropical cyclone activity alongside of Japan and even over Hawaii (Big Island), with 20” of rain (look closely in the anomaly map for the rainfall track). A little further east one can also see additional tropical cyclone tracks, with a negative anomaly to the south (somewhat La Niña-like), indicating the ITCZ in this area is located a little to the north than its usual position. On the other hand, the Atlantic ITCZ is located a little to the south of its normal position, and the eastern Atlantic was devoid of tropical systems in August. However, early in the month Hurricane Debby developed and provided copious rain for Cuba and along the East Coast of the U.S. for Florida, Georgia and South Carolina (up to 10”) and then over Pennsylvania and New York state (5”).
South America is dominated by drier than normal areas for August, especially along the northern coast. North America is mostly covered by negative anomalies across the southern U.S. and northern Canada, with positive anomalies along the border between the two and along the aforementioned East Coast and Alaska.
The rainfall regime over tropical Africa was active in August, with positive anomalies along its broad ITCZ and associated flooding in Nigeria and Sudan and even across the Red Sea in Yemen (100 dead). Western and southern Europe were drier than average, with wildfires in Greece, very close to Athens. Farther north positive anomalies were noted over central Eurasia.