Global climate summary for July 2022
Highlights from Assessing the Global Climate in July 2022
Globally, July 2022 was the sixth-warmest July in the 143-year NOAA record. The year-to-date (January-July) global surface temperature was also the sixth-warmest on record. According to NCEI’s Global Annual Temperature Outlook, there is a greater than 99% chance that 2022 will rank among the 10-warmest years on record but only an 11% chance that it will rank among the top five.
The July global surface temperature was 1.57 °F (0.87 °C) above the 20th-century average of 60.4 °F (15.8 °C). This ranks as the sixth-warmest July in the 143-year record. July 2022 marked the 46th consecutive July and the 451st consecutive month with temperatures, at least nominally, above the 20th-century average. The five warmest Julys on record have all occurred since 2016.
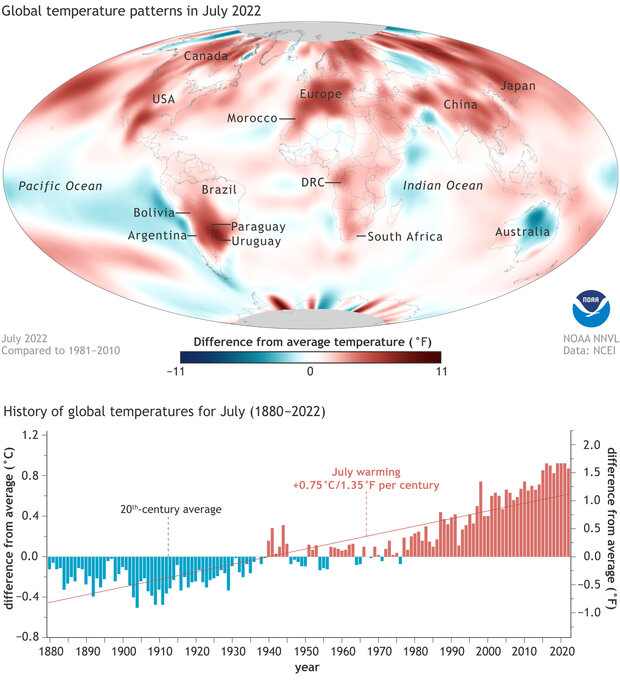
(top) Earth's surface temperature in July 2022 compared to the 1981-2010 average. Places that were warmer than average are red, while places that were cooler than average are blue. (bottom) July temperatures each year compared to the 20th-century average. Cooler-than-average years are blue; warmer-than-average years are red. NOAA Climate.gov image, based on data from NOAA National Centers for Environmental Information.
The month of July was characterized by warmer-than-average conditions across much of North America, Asia, Europe, and South America. Record-high July temperatures were observed in parts of North and South America, southern and eastern Asia, and Europe, as well as parts of the western and southern Pacific Ocean. During the month, an unprecedented heat wave affected much of Europe and many European countries, including Italy, Portugal, Spain, and the United Kingdom, set new record-high July maximum temperatures. Sea surface temperatures were above average across much of the Gulf of Mexico and the northern, western, and southwestern Pacific, as well as parts of the Atlantic and eastern Indian oceans. Overall, the record-warm July temperatures encompassed over 7.3% of the world's surface — the fourth-highest percentage for record-high July temperatures.
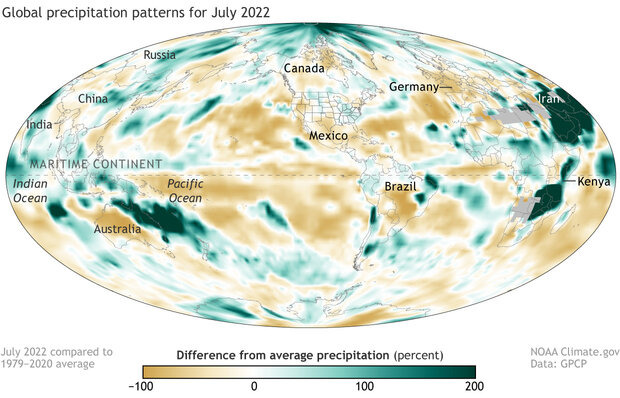
Difference from average precipitation across the globe in July 2022. Places where precipitation was 200 percent or more above average are green. Places where precipitation was up to 100 percent below average (i.e., no measurable precipitation) are brown. The broad swath of below-average precipitation across the central-to-eastern Pacific at the equator is typical of La Niña, as is the wetter-than-average conditions across parts of Australia and the Maritime Continent. NOAA Climate.gov map, based on data from the Global Precipitation Climatology Project.
Precipitation highlights from the Global Climate Report for July 2022
The strongest feature [of the July map] on the dry side is in the western Pacific, just south of the Equator, with the equatorial Pacific in general having broad negatives, with embedded, small positive areas. To the west, over the Maritime Continent, South Asia and the North Indian Ocean positive anomalies dominate, with smaller dry anomalies embedded.
Although Australia tends to have generally wet conditions during La Niña..., this July only the eastern part indicates that concurrence, but that monthly feature contained a 250 mm daily rainfall total in Sydney very early in the month with associated serious flood conditions there and surrounding areas. Over South Asia, the summer monsoon has been very wet in some locations including Indochina and especially western India and Pakistan with floods in northern and western India. The above normal percentage rainfall over the eastern part of the Arabian Peninsula and to the east...is linked to floods in Oman, Yemen, Iran and Afghanistan at various times of the month.
For more details on the July climate around the globe, including major events, sea ice, and global tropical cyclone activity, read NOAA National Centers for Environmental Information's July 2022 climate summary or the full monthly report.