Global climate summary for June 2023
This text is excerpted from the full June 2023 climate report from NOAA National Centers for Environmental Information.
Highlights
- For the third consecutive month, global ocean surface temperatures set a record high.
- Smoke plumes from Canada’s most destructive wildfire season reached European skies.
- Antarctica saw its second consecutive month of record-low sea ice extent.
- With nine tropical storms across the globe, June 2023 had a global accumulated cyclone energy that was almost twice its average value for the month.
Temperature
The June global surface temperature was 1.89°F (1.05°C) above the 20th-century average of 59.9°F (15.5°C), making it the warmest June on record. This marked the first time a June temperature exceeded 1.8°F (1°C) above the long-term average. June 2023 was 0.23°F (0.13°C) warmer than the previous June record from 2020, but 0.52°F (0.29°C) cooler than the all-time highest monthly temperature anomaly on record (March 2016). June 2023 marked the 47th consecutive June and the 532nd consecutive month with temperatures at least nominally above the 20th-century average.
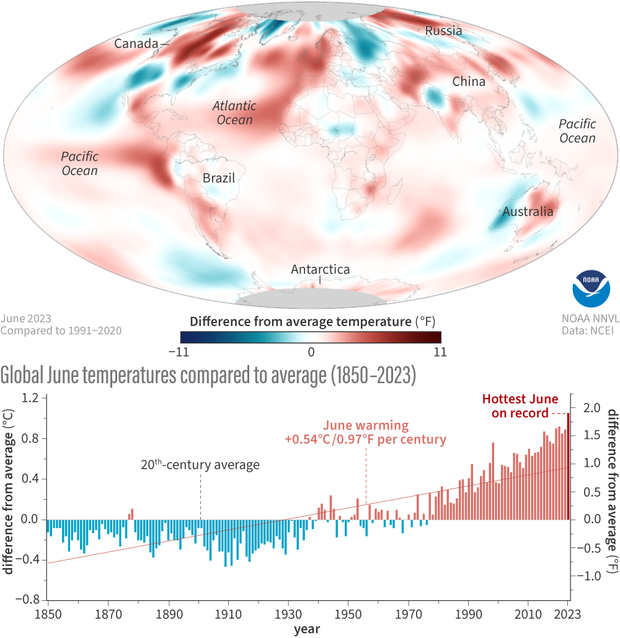
(map) Monthly average surface temperature in June 2023 compared to the 1991-2020 average, with places that were warmer than average colored red and places that were cooler than average colored blue. (graph) June temperatures compared to the 20th-century average for each year from 1850 to 2023. The final bar is the tallest: 2023 set a new high for the warmest June on record. Graphics by NOAA Climate.gov, based on data from NOAA National Centers for Environmental Information.
For the third consecutive month, global ocean surface temperature hit a record high. Weak El Niño conditions that emerged in May continued to strengthen in June, as above-average sea surface temperatures returned to the equatorial Pacific Ocean. Globally, June 2023 set a record for the highest monthly sea surface temperature anomaly of any month in NOAA’s 174-year record. June heat was not limited to the ocean surface; the Southern Hemisphere had its warmest June on record and the Northern Hemisphere tied 2019 for its warmest June.
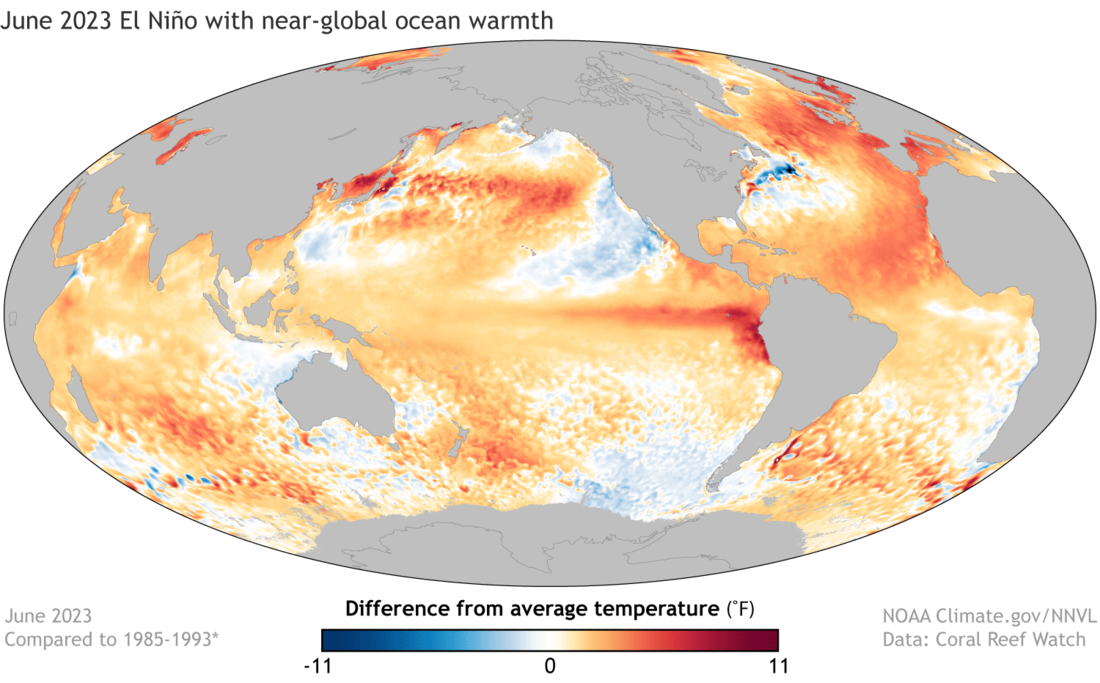
June 2023 sea surface temperature difference from the 1985-1993 average (details from Coral Reef Watch). Much of the global oceans are warmer than average. NOAA Climate.gov image from Data Snapshots.
Precipitation
- June 2023 was the warmest June on record for the globe, and almost the wettest June for the globe too.
- El Niño is affecting tropical rainfall anomaly patterns, but only weakly.
- Dryness in Canada helped produce wildfires affecting air quality there and in the U.S.
- Dry North Atlantic extends into northern Europe.
On the temperature side of things, this June had the highest global surface temperature of any June (since 1850), partially due to the developing El Niño on an inter-annual scale, in addition to global warming on the longer time scale. The global precipitation number is much more highly variable than the global surface temperature, but has a weak positive trend, increasing at an overall rate of about 1.5%/K over the last 40 years, similar to what is evident from climate models (see Gu and Adler, 2022). For this June, the GPCP total of 2.78 mm/d is second only to June of 2002 with 2.79 mm/d fitting in general into that positive trend, although the precipitation variations may lag the temperature.
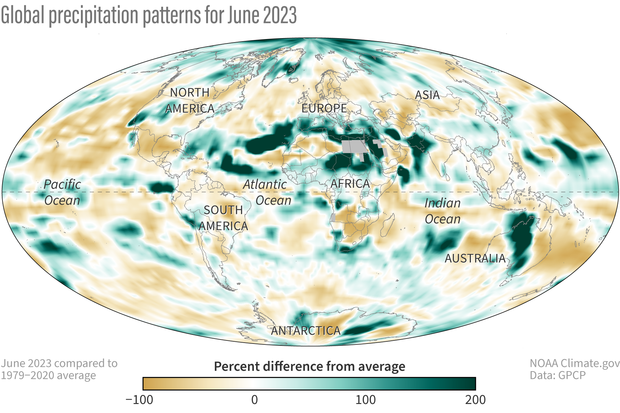
Precipitation in June 2023 as a percent difference from average, with places that were drier than average colored brown, and places that were wetter than average colored greenish blue. NOAA Climate.gov image, based on data from the Global Precipitation Climatology Project.
The anomaly patterns [anomaly means "difference from average"] emphasize the variable nature of the Intertropical Convergence Zone (ITCZ) across the tropics, with above average rainfall over the ocean in the Atlantic, Eastern Pacific, Western Pacific and Indian Oceans. The usually rainy northern South America had a negative deficit this June, whereas tropical Africa had excess rainfall. These ITCZ anomaly features reflect the weak El Niño, but only to a certain degree. Over the Maritime Continent [the islands and peninsulas between Asia and Australia], where El Niños typically bring dry conditions, there were again variable positive and negative features, although the negative (dry) features seemed to dominate.
The Asian monsoon had a variable start across South Asia. A heat wave and dry conditions during the month killed 100 people, with the rainfall deficit feature covering much of eastern India. Just to the west a swath of positive anomaly is associated mainly with Tropical Cyclone Biparjoy, which moved northward in the Arabian Sea and came ashore at the Pakistan–India border, providing an early start to the monsoon. Early in the month, tropical cyclones tracked northward eastward of the Philippines and Taiwan and one of them (Mawar) grazed Japan, but produced heavy rain (490 mm in 24 hrs) and flooding in the Tokyo area.
Over North America, a mottled pattern of anomalies had parts of the western U.S. with positive anomalies, but most of the southwest and Mexico and central America under drought conditions. Much of Canada and the eastern U.S. were dry, with the conditions in Canada producing many wildfires both in the west and the east resulting in copious smoke which affected air quality both in Canada and in much of the eastern U.S. In the Atlantic, a brief Tropical Storm Arlene in the Gulf of Mexico and Tropical Storm Bret across the Atlantic into the Caribbean began the Atlantic storm season and contributed to the positive rainfall anomalies seen in the tropical North Atlantic.
For a full look at June climate, including major events, temperature rankings for land and ocean, and land-based precipitation statistics, see NOAA's June 2023 Climate Report.