Global climate summary for May 2022
Temperature highlights from Assessing the global climate in May 2022
The May global surface temperature was 1.39°F (0.77°C) above the 20th-century average of 58.6°F (14.8°C). This ranks as the ninth-warmest May in the 143-year record, 0.30°F (0.17°C) cooler than the warmest May months (2016 and 2020). It was the coolest May since 2013, but it still marked the 46th consecutive May and the 449th consecutive month with temperatures, at least nominally, above the 20th-century average. The ten warmest May months have all occurred from 2010 to present.
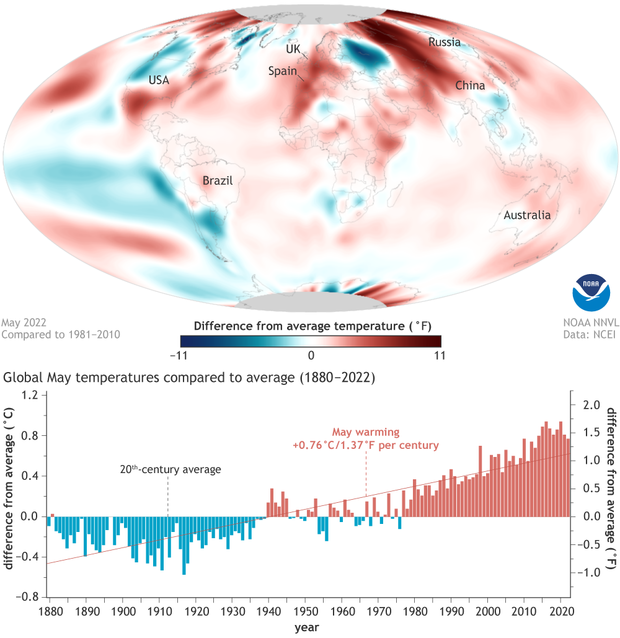
(map) Temperatures in May 2022 compared to the 1981-2010 average. Places that were warmer than average are red; places that were cooler than average are blue. Over the land surface, the largest warm anomaly in May was centered over north-central Asia, and the largest cold anomaly was centered over eastern Europe. (graph) May temperatures compared to the 20th-century average for each year from 1880 to 2022. May has grown warmer by 1.37 degrees Fahrenheit (0.76 degrees Celsius) per century on average over the historical record, but the past three decades have been warming roughly twice as fast. Map and graph by NOAA Climate.gov, based on data from NOAA National Centers for Environmental Information.
Approximately 7% of the world's surface had a record-high temperature in May—the third highest May percentage since 1951. Record-high temperatures were apparent over 6% of the land surface (such as in western Europe, central Asia, and the Horn of Africa) and over about 8% of the ocean surface (particularly in the southern subtropical eastern Pacific). None of the world's surface had a record-cold temperature in May.
Precipitation highlights
Across the central to eastern Pacific, a thin east-west line of positive anomalies [areas of above-average precipitation] hovers just north of the equator, with a parallel set of distinct negative anomalies just to the south. These two coupled features indicate an ITCZ [Intertropical Convergence Zone] just to the north of its climatological position for this month. Similar features have existed for the last few months. To the west along the equator the strongest negative anomaly [below-average precipitation] on the globe sits in the western Pacific east of New Guinea. This is the continuing, month-after-month defining feature of the ongoing La Niña.
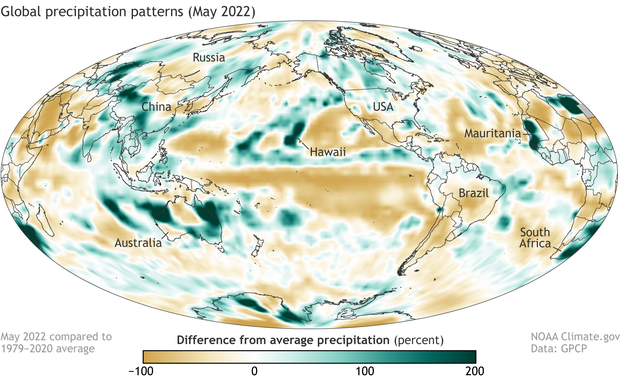
Percent difference from average precipitation for May 2022. Places where precipitation was 200 percent or more above average are darkest green; places where precipitation was up to 100 percent below average (i.e. no rainfall) are brown. NOAA Climate.gov map, based on data from the Global Precipitation Climatology Project.
To the west a collection of positive anomaly features extends from Japan in a horseshoe-shaped feature through Indochina, the Borneo area and across and to the east of Australia. This generally greater-than-normal rainfall zone is the counterpoint in the main La Niña couplet to the negative area to the east. These features were associated with floods in northeast Australia, Indonesia, northeast India, Bangladesh, Vietnam, and southern China. The eastern half of the Indian Ocean experienced plentiful rainfall and was also visited by two simultaneous tropical cyclones north and south of the equator, adding to the pattern.
However, the western part of the ocean and land areas to the west and north were dry, typical of La Niña conditions, with a heat wave in northwest India and Pakistan early in the month, drier than normal conditions across the Arabian Peninsula, and sandstorms in Iraq. Even worse, the Horn of Africa region continued under a multi-season drought that is in danger of causing famine conditions amid chaotic political conditions. Floods in eastern South Africa were associated with the monthly positive feature there.
For more details on the global climate in May, including sea ice conditions, extreme events, and conditions for the year to date, read the full report from the National Centers for Environmental Information.