January 2021 global climate brought contrasting extremes of temperature and precipitation to the Northern Hemisphere
Last week, NOAA’s National Centers for Environmental Information released their summary of the global climate for January 2021. Averaged across the land and ocean, it was the seventh-hottest January on record dating back to 1880, with average global temperature 0.80 degrees Celsius (1.44 degrees Fahrenheit) above the twentieth-century average.
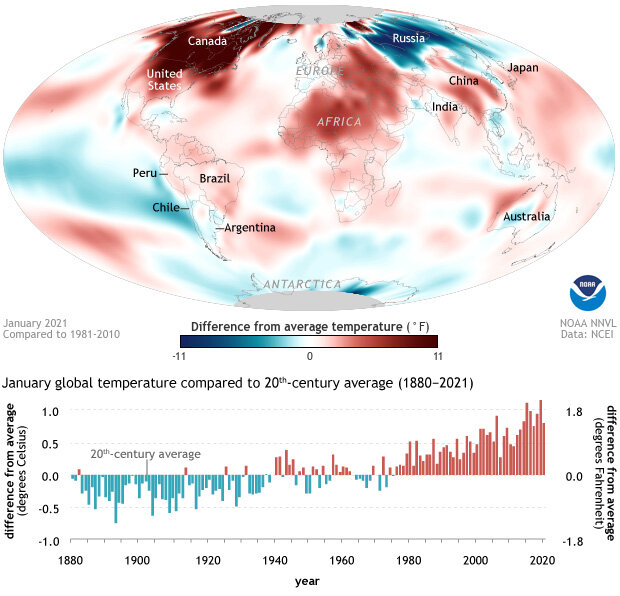
(map) Temperatures across the globe in January 2021 compared to the 1981–2010 average, with warmer-than-average areas colored red, and cooler-than-average areas colored blue. Extreme warmth across high latitudes of North America contrasted sharply with extreme cold across northern Russia. North Africa was also significantly warmer than average. (graph) January temperatures compared to the twentieth-century average each year from 1880–2021. January 2021 was the seventh-warmest January on record. NOAA Climate.gov image based on data from NCEI.
According to NCEI,
During January 2021, northern North America, northern Africa, southeastern Europe, and parts of the Middle East had the most notable temperature departures that were at least 2.5°C (4.5°F) above average….Record warm January temperatures were present across parts of the Pacific and Atlantic oceans, as well as, parts of eastern Canada, northern Africa, the Mediterranean Sea, and southern Asia. As a whole, about 5.93% of the world's surface had a record-warm January temperature–the third highest January percentage since records began in 1951.
Areas that experienced a cooler-than-average January include Western Europe, Russia, and parts of Australia. Regarding Europe, NCEI wrote,
· Cooler-than-average conditions engulfed much of Spain during January 2021, resulting in a national temperature that was 0.6°C (1.08°F) cooler than average—this was the coldest January since 2009 for Spain and the 16th coldest since national records began in 1961.
· The United Kingdom had its coldest January since 2010 with a temperature departure of 1.5°C (2.7°F) below average. Regionally, England and Scotland and Northern Ireland also had their coldest January since 2010. According to the UK Met Office, the first two weeks of January brought wintry conditions to the region, which caused some travel disruption.
· Sweden had its coldest January since 2016.
In addition to the extreme contrast in temperature patterns between North America and northern Asia, January 2021 also brought a contrast of precipitation patterns. According to NCEI,
January precipitation was generally drier than normal across parts of the northern contiguous U.S., as well as across the Rocky Mountains and the southeastern U.S, Mexico, eastern Brazil, northern Russia, southern parts of Asia, and western and northeastern Australia. Wetter-than-normal conditions were notable across the central contiguous U.S., northern South America, northern Argentina, much of Europe, southwestern Russia, and southeastern Australia.
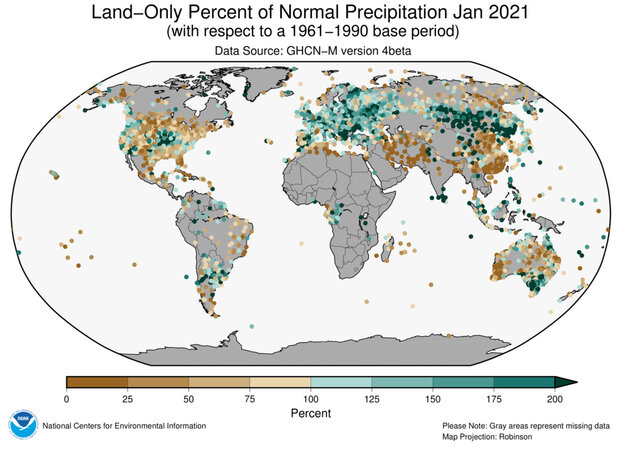
Precipitation patterns across land areas of the globe in January 2021, shown as a percent of the 1961-1990 average for each location. Brown areas show places that received less than 100 percent of average, while blue-green shows places that received more than 100 percent of their average. The mid-latitudes of the United States were on the dry side, while much of Europe and southeastern Russia were unusually wet. Map by NOAA NCEI.
Considering only the ocean portion of Earth’s surface, the main January story is the continuation of La Niña in the tropical Pacific Ocean. La Niña is the cool phase of the El Niño-Southern Oscillation climate pattern—the most significant source of year-to-year variation in global climate. In addition to the signature of La Niña, NCEI reported that cooler-than-average sea surface temperatures were present in the southeastern Pacific and the North Atlantic, south of Greenland.
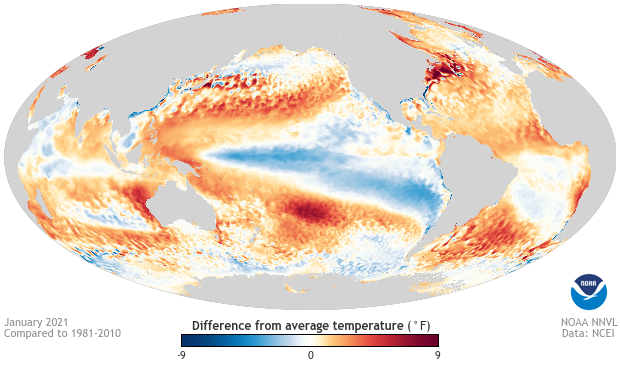
Global ocean surface temperatures in January 2021 compared to the 1981–2010 average, with warmer-than-average surface waters in shades of red and orange, and cooler-than-average waters in shades of blue-green. The broad swath of cooler-than-average waters across the tropical Pacific due to the La Niña climate pattern dominates the monthly view. Image from Climate.gov Data Snapshots map collection, based on OISST data from NOAA's Environmental Visualization Lab.
NCEI noted that,
A small area in the southeastern Pacific Ocean had a record cold January temperature, which represents only 0.25% of the globe. January 2021 marked the first time since October 2019 (0.37%) where a record cold temperature occurred.
For more maps, graphs, and analysis of January global climate patterns, visit NCEI's State of the Climate website.