June 2021 was fifth-warmest on record
According to the June 2021 global climate summary from NOAA’s National Centers for Environmental Information (NCEI),
The June 2021 global surface temperature was 1.58°F (0.88°C) above the 20th-century average of 59.9°F (15.5°C)—the fifth-warmest June in the 142-year record. June 2021 marked the 45th consecutive June and the 438th consecutive month with temperatures, at least nominally, above the 20th-century average.
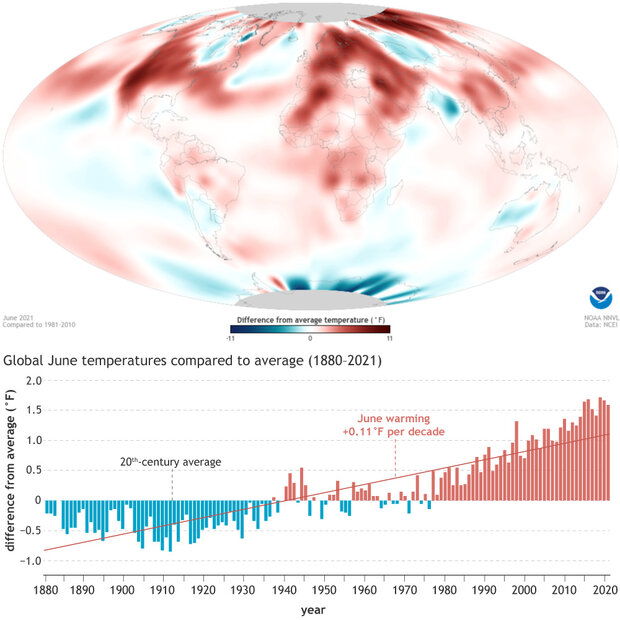
(top) Average surface temperatures in June 2021 compared to the 1981-2010 average. (bottom) June temperatures compared to the 20th-century average from 1880 to 2021. Image by NOAA Climate.gov, based on data from NCEI.
NCEI’s Climate at a Glance tool shows that globally, June has grown warmer by 0.11 degrees Fahrenheit per decade over the historical record. Consistent with the long-term warming trend, the report notes:
Only Junes of 2015 (fourth warmest), 2016 (second warmest), 2019 (warmest), and 2020 (third warmest) were warmer [than 2021] and had a global temperature departure above +0.90°C (+1.62°F). Nine of the 10 warmest Junes have occurred since 2010. June 1998 is the only June from the previous century among the 10 warmest Junes on record, and currently ranks as the tenth warmest June on record.
Land areas were record warm in June, strongly boosted by the back-to-back heatwaves that broiled first the U.S. Southwest and then the Pacific Northwest and nearby areas in Canada. Meanwhile the ocean was “just” sixth-warmest on record, with several areas having cooler-than-average June temperatures, including the central and eastern tropical Pacific Ocean (the lingering effects of the recently ended La Niña), parts of the southeastern Pacific Ocean, and the North Atlantic.
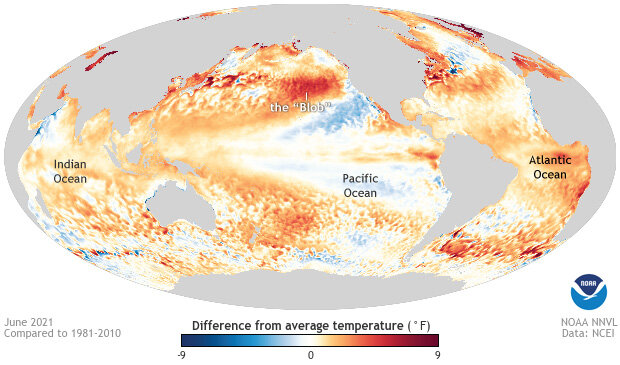
Temperatures across the world's oceans in June 2021 compared to the 1981-2010 average. Places that were warmer than average are yellow, orange, and red; places that were cooler than average are blue. While the eastern Pacific was cooler than average both north and south of the equator, a large Blob of warm temperatures dominated the North Pacific. Climate.gov images based on data from NCEI/EVL
For more details on June 2021 and year-to-date climate statistics, including details on precipitation, extreme events, the hurricane season to date, and much more, see NCEI’s June 2021 State of the Climate report.