National Climate Assessment team updates key indicators of global climate change
Certain aspects of our global system provide clear indications of how climate is changing. Surface temperatures, atmospheric carbon dioxide concentrations, sea ice extent, glacier mass, and many other physical and biological aspects of our climate system are all types of “climate indicators.” The U.S. Global Change Research Program (USGCRP) recently updated its collection of indicators with the latest data and graphics.
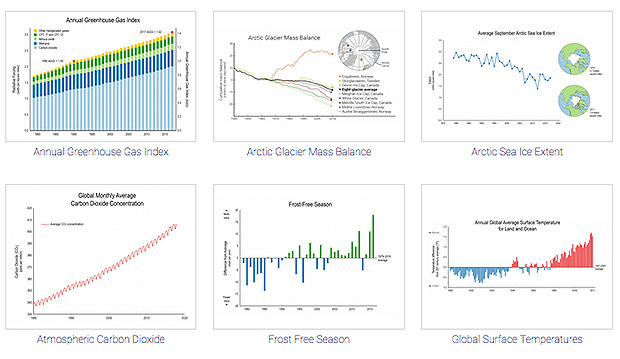
A screenshot from the key climate indicators webpage of the U.S. Global Change Research Program. The indicators were recently updated as part of the National Climate Assessment process.
Maintaining the indicators is part of the program’s mission—mandated by Congress in 1990—to understand, predict, and respond to climate change and its impacts on the United States. Every four years, the program reviews and evaluates the “state of the science” on global climate, updates the indicators, and issues the National Climate Assessment, a report that explains what current and future climate change is likely to mean for the United States. The 2017 Climate Science Special Report came out last year, and the 4th National Climate Assessment is scheduled for release in late 2018.
Many of the indicators in the USGCRP selection are similar to those from other sources, such as the yearly State of the Climate report or Climate.gov’s own Global Climate Dashboard. One may vary slightly from the other depending on the source of its data, but they all reveal the same trends: carbon dioxide and other greenhouse gas concentrations are increasing, temperatures are warming, sea levels are rising, and ice extent and glacier mass are decreasing.
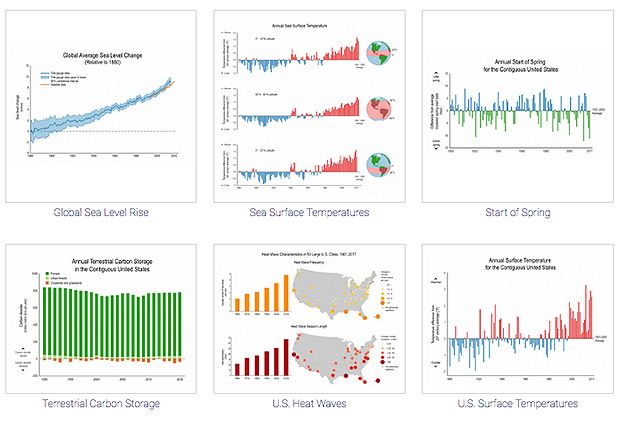
Screenshot of several more indicators from the webpage of the the U.S. Global Change Research Program.
The USGCRP collection includes the big names in global indicators—surface and sea surface temperature, greenhouse gas concentrations, sea ice extent, glacier mass balance—but it also includes some more U.S.-focused indicators such as the start of spring, heavy precipitation, and heat waves.
Start of spring
The start of spring indicator tracks “when growth can begin for temperature-sensitive native and cultivated plants,” not the actual day of the year when spring season starts. Warming global temperatures push the date earlier by making growing conditions more favorable and allowing dormant plants to sprout earlier than they did in the past.
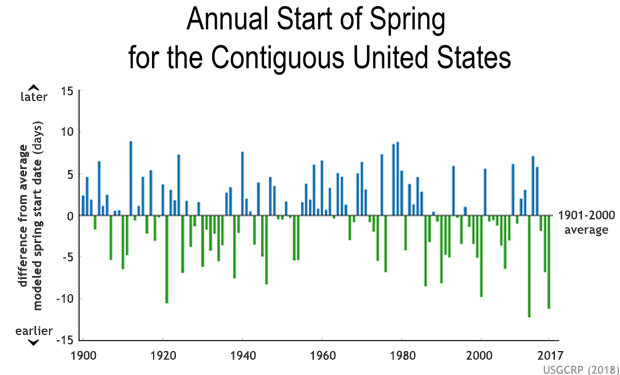
On average, the start of spring has been occurring earlier since 1984 due to global warming. The earliest start of spring occurred in 2012 as warming temperatures allow plants to sprout earlier in the year.
Since 1984, the start of spring in the United States has occurred earlier relative to the last century’s average, according to the USCGRP. The earliest start was in 2012. The model the USGCRP uses to calculate the first growing day of spring is based on daily minimum and maximum temperatures along with long-term observations of lilac and honeysuckle first-leaf and first-bloom days kept by generations of gardeners.
Heavy rain
How much of a location’s precipitation falls in heavy, single-day events has big consequences for society—from public health and safety to the impact on roads and other infrastructure. Global warming may cause more heavy rain because a warmer atmosphere can hold more water vapor, which can then make more precipitation. Additionally, warming may impact the frequency of heavy precipitation events.
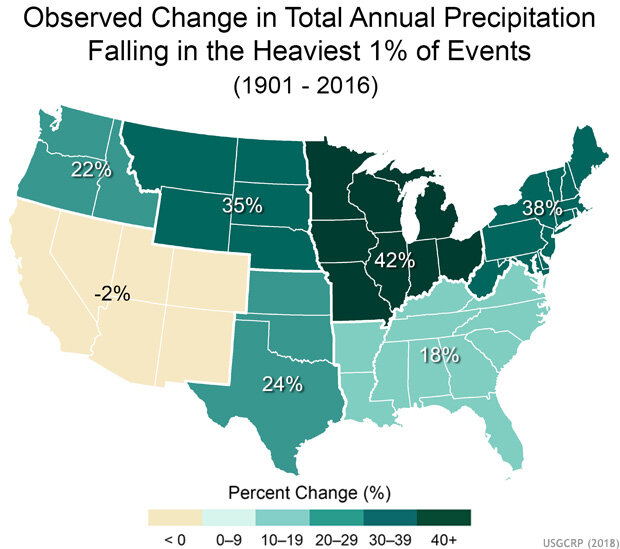
This indicators hows the increase or decrease in the amount of rain that falls as heavy rain across the country. Most of the country now receives more rain as heavy rain than in the past. From the USGCRP Indicator Platform.
The USGCRP defines heavy precipitation events as the top 1% of single-day rainfall totals during a set time period. The USGCRP compared two different time periods, 1901-1960 and 1986-2016, to determine how much precipitation falls as heavy rain now compared to in the past. What this comparison found is that more rain is falling as heavy rain across most of the United States, particularly in the Northeast and Midwest. More heavy rain increases flash flood risks and could damage infrastructure.
Heat waves
The USGCRP also added a new indicator based on an EPA analysis and NOAA data to evaluate trends in U.S. heatwaves—which can cause illness or death, harm agriculture, and impact infrastructure—in order to see how climate change impacts the frequency of heat waves and the length of the heat wave season. The USGCRP classifies a heat wave as a period of two or more consecutive days on which the overnight low temperatures (after being adjusted for humidity) exceed the 85th percentile (i.e. the hottest 15%) of the historical average for a given city.
The analysis adjusted for humidity because high humidity amplifies a heat wave’s impacts on the human body by filling the air with moisture and hindering sweat from evaporating off people’s skin. USGCRP analyzed heat wave data from 1961-2017 and used the 1981-2010 timeframe as its point of comparison.
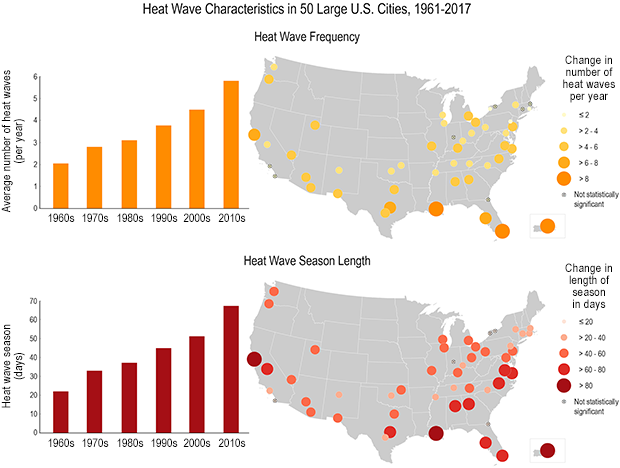
The heat wave indicator shows how the heat wave season has grown longer and how the frequency of heat waves has also increased. From the USGCRP Indicator Platform.
The indicator shows that the frequency of heat waves increased from an average of two heat waves per year during the 1960s to around six per year during the 2010s. The average heat wave season is also 45 days longer now than in the 1960s. An increase in heat waves may pose the most risk during nighttime, when air temperature stays too warm and further strains people’s bodies as they try to recover after an already hot day.
Explore the whole collection
While these are a few of the USGCRP’s more unique indicators, their collection holds a total of fifteen different indicators that tell the story of climate change. Having a collection like this grounded in actual data demonstrates objectively how global warming affects all parts of our planet.