NOAA's 2016 Arctic Report Card: Visual highlights
Now in its 11th year, the Arctic Report Card, released today at the annual American Geophysical Union fall meeting in San Francisco, is a peer-reviewed report that brings together the work of 61 scientists from 11 nations who report on air, ocean, land and ecosystem changes. It is a key tool used around the world to track changes in the Arctic and how those changes may affect communities, businesses and people. Below are a collection of maps and other images highlighting some of this year's key findings.
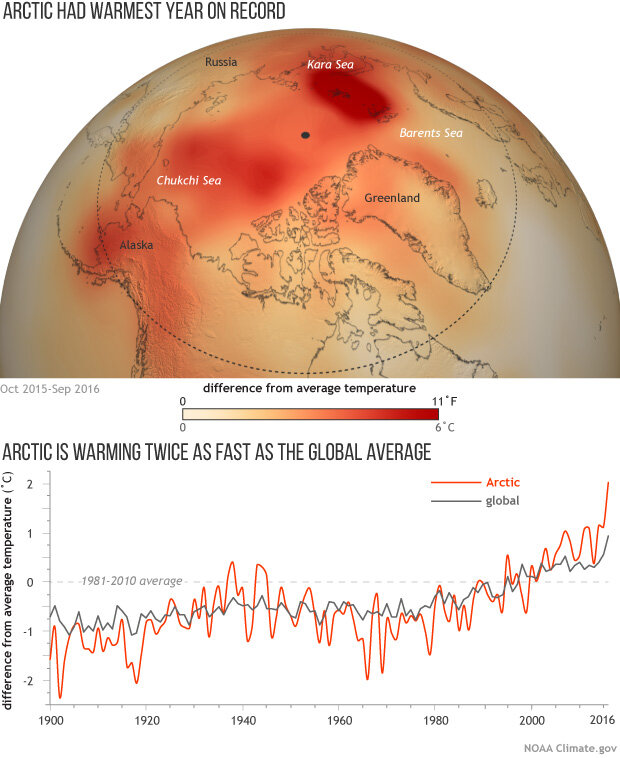
(map) Temperatures across the Arctic from October 2015-September 2016 compared to the 1981-2010 average. (graph) Yearly temperatures since 1900 compared to the 1981-2010 average for the Arctic (orange line) and the globe (gray). NOAA Climate.gov map based on NCEP reanalysis data from NOAA's Earth System Research Lab. Graph adapted from Figure 1.1 in the 2016 Arctic Report Card.
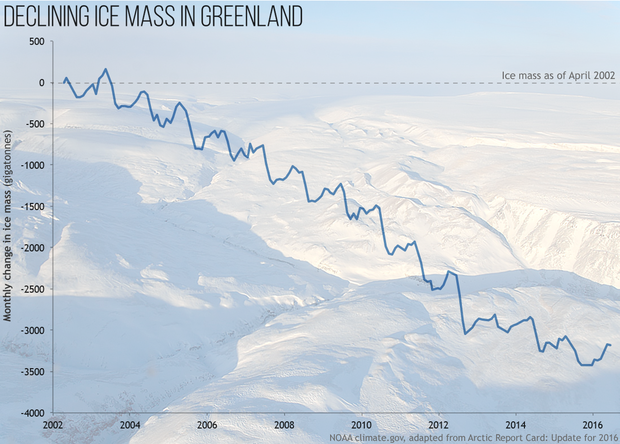
Monthly change in the total mass (in gigatonnes) of the Greenland Ice Sheet between April 2002 and April 2016, based on GRACE satellite data. The ice sheet lost an average of 268 gigatonnes per year from 2002 to 2016. NOAA Climate.gov graph adapted from Figure 3.4 in the 2016 Arctic Report Card. Background photo from NASA P3-Orion aircraft.
Decades ago, the majority of the Arctic's winter ice pack was made up of thick, perennial ice. Today, very old ice is extremely rare. This animation tracks the relative amount of ice of different ages from 1990 through early November 2016. Seasonal ice is darkest blue. Ice that is 9 or more years old is white.
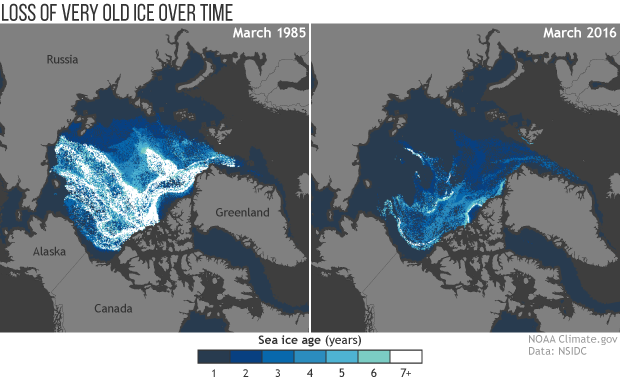
The age of the sea ice in the Arctic Ocean at winter maximum in March 1985 (left) compared with March 2016 (right). The darker the blue, the younger the ice. The first age class on the scale (1, darkest blue) means "first-year ice,” which formed in the most recent winter. The oldest ice (7+, white) is ice that is more than seven years old. Historically, most of the ice pack was many years old. Today, only a fraction of that very old ice reamins. See our animation of weekly sea ice age since 1990. NOAA Climate.gov maps, based on NOAA/NASA data provided by Mark Tschudi.
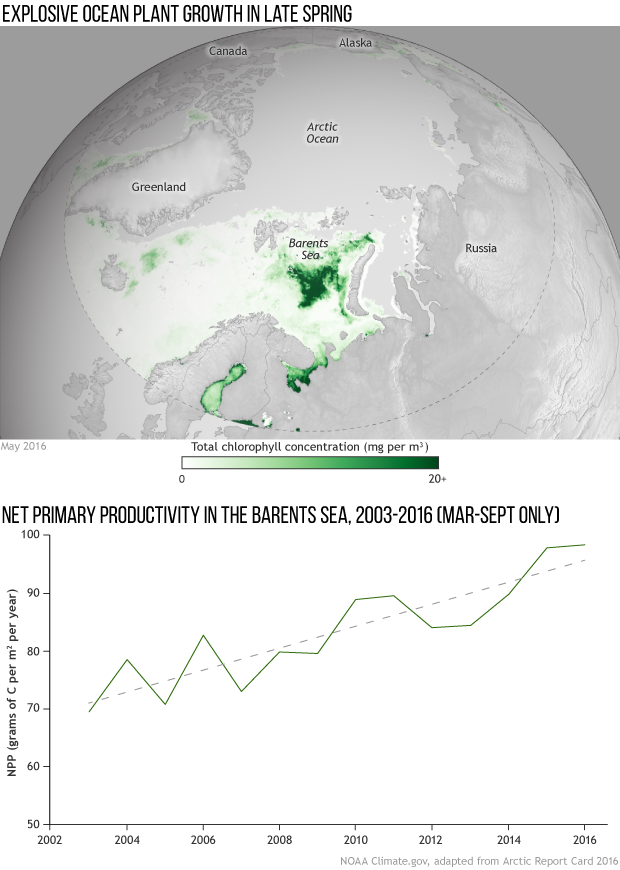
(map) Total chlorophyll concentration across the Arctic in May 2016. The darker the green, the higher the chlorophyll concentration. The light gray indicates areas where there was no data due to clouds or ice. In some areas, chlorophyll concentrations averaged more than 14 milligrams per cubic meter higher than the 2003-2015 mean. (graph) Net primary productivity (the net carbon gain or loss by growing plants) in the Barents Sea for March-September 2003-2016. NOAA Climate.gov map derived from NASA/MODIS-Aqua data. Graph adapted from Figure 6.4 in the 2016 Arctic Report Card.
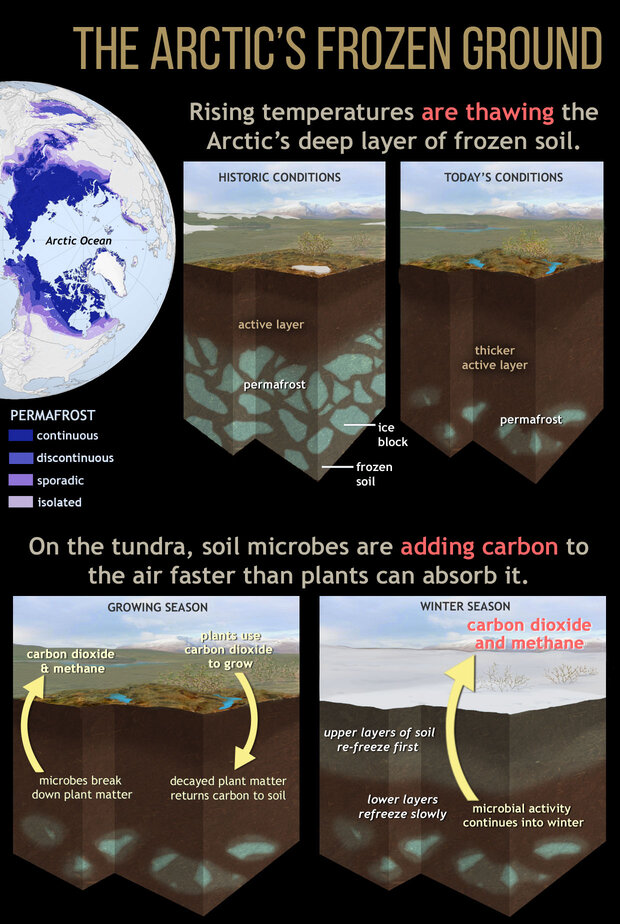
Permafrost is like a giant freezer for carbon: thousands of years worth of plant, animal, and microbe remains mixed with blocks of ice. Historically, only a shallow "active layer" thawed in the short summer. In today's warming Arctic, permafrost is thawing, and the active layer is getting deeper. Warming in the growing season has increased plant growth and allowed plants to remove more carbon dioxide (CO2) from the air during photosynthesis, but decomposition of organic matter by soil microbes is also releasing carbon dioxide and methane. In the past decade, the parts of the Arctic tundra that are routinely observed have become a net source of carbon-containing greenhouse gases because microbial activity is continuing well into winter after plants go dormant. NOAA Climate.gov drawing. Permafrost map from NSIDC.
Links
Listen in on the press conference (you won't be able to ask questions)
Browse the entire Arctic Report Card online