State of the Climate: 2011 Global Surface Temperature
La Niña conditions in the tropical Pacific Ocean throughout much of 2011 contributed to an overall cooler year than 2010, which ranked as either warmest or second warmest year on record, depending on a range of analyses. The map below shows 2011 surface temperatures across the globe compared to the long-term average.
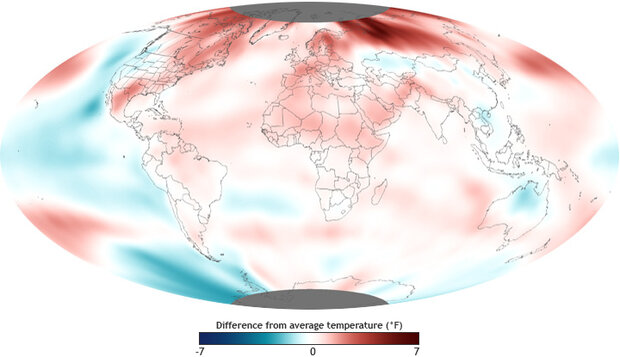
The map shows 2011 surface temperatures across the globe compared to the long-term average. Places that were up to 7 degrees Fahrenheit cooler than the 1981-2010 average are dark blue, near-average temperatures are white, and places where temperatures were up to 7 degrees F warmer than average are red. NOAA map by Dan Pisut, NOAA Environmental Visualization Lab, based on based on Merged Land and Ocean Surface Temperature data from the National Climatic Data Center.
Warmer-than-usual temperatures dominated both land and sea. La Niña contributed to the cooler than average sea surface temperatures in the equatorial Pacific as well as cooler temperatures in southeastern Asia, northwestern United States, and parts of Australia where La Niña drove more precipitation.
Unusually high temperatures affected most land areas during 2011, with the most prominent warmth across the higher latitudes of the Northern Hemisphere. Norway, for example, had its warmest year on record. This pattern of amplified warmth at high northern Latitudes has been a recurring theme in recent years.
Despite the double-dip La Nina that occurred throughout the year, 2011 was still among the 15 warmest years on record. When compared with other La Niña-influenced years in the long-term record, 2011 was unusually warm.
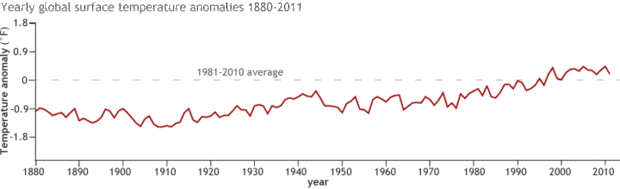
The graph shows Earth’s average annual surface temperature is higher today than it was when record-keeping began in the late 1800s, an indicator of long-term, global-scale climate warming. The red line shows how far above or below the 1981-2010 average (dashed line at zero) the combined land and ocean temperature has been each year since 1880. The data shown are one of several temperature analyses included in the State of the Climate in 2011, all of which show a warming trend. Graph adapted from Figure 2.2, in BAMS’ State of the Climate in 2011.
Earth’s average annual surface temperature is higher today than it was when record-keeping began in the late 1800s, an indicator of long-term, global-scale climate warming. The red line shows how far above or below the 1981-2010 average (dashed line at zero) the combined land and ocean temperature has been each year since 1880. The data shown are one of several temperature analyses included in the State of the Climate in 2011, all of which show a warming trend.
The 2011 average global surface temperature was between 0.07 and 0.16 degrees Celsius warmer (0.13 and 0.29 degrees Fahrenheit), than the 1981–2010 average, based on a range of analyses. Including the 2011 temperature, the rate of warming since 1971 is now between 0.14° and 0.17° Celsius per decade (0.25°-0.31° Fahrenheit), and 0.71-0.77° Celsius per century (1.28°-1.39° F) since 1901.
NOAA map by Dan Pisut, NOAA Environmental Visualization Lab, based on based on Merged Land and Ocean Surface Temperature data from the National Climatic Data Center. Graph adapted from Figure 2.2, in BAMS’ State of the Climate in 2011. Caption by Caitlyn Kennedy. Reviewed by Jessica Blunden and Deke Arndt.
Reference
Sánchez-lugo, A., J. J. Kennedy, and P. Berrisford: 2012: [Global climate] Surface temperature [in “State of the Climate in 2011”]. Bull. Amer. Meteor. Soc., 93 (7), S14–S15.
![]()