U.S. climate outlook for July 2024
For those hoping for a respite from above-normal temperatures, June was a big disappointment, as warmer-than-normal temperatures dominated large parts of the United States. In addition, significant heat waves were observed both in the West (early in the month), and then in the central and eastern parts of the country during the second half of the month. As is often seen during hot summer months, rainfall was below normal across much of the western and eastern parts of the nation, with above-average precipitation falling only in parts of the upper Midwest and southern Plains. With summer off to a very hot start, will temperatures remain above-average or will we see a break from the heat? After a fairly dry June, will drought become a significant problem across the country? Here’s the outlook for July from NOAA’s Climate Prediction Center (CPC).
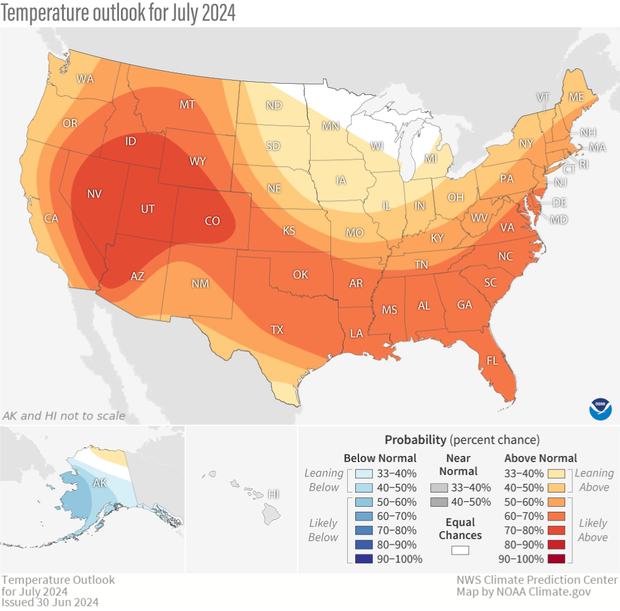
The U.S. temperature outlook for July 2024, showing where the average temperature is favored to be much warmer than average (orange and red), near average (gray), or much cooler than average (blues). Darker colors mean higher chances, not more extreme temperatures. White areas mean that there are equal chances for a warm, cool, or near-average July. Much warmer or much cooler than average means "in the upper or lower third" of July temperatures from 1991-2020. Text-only forecast for Hawaii available from NOAA Climate Prediction Center.
On June 30, CPC released its updated monthly climate outlooks for temperature, precipitation, and drought across the United States for July 2024. The temperature outlook favors well above average temperatures across almost the entire nation, with no tilt in odds toward any category over parts of the northern Midwest. The precipitation outlook favors well above average precipitation along the Gulf Coast and the entire Atlantic Seaboard, the northern Midwest. Well below average precipitation is favored in a region extending from the Pacific Northwest southeastward to the Southern Plains. And with expectations that the hot June will continue throughout July, drought development is predicted for significant parts of the Southeast, the Ohio Valley, the Southern Plains, and in a region extending from Montana and Wyoming westward to Washington.
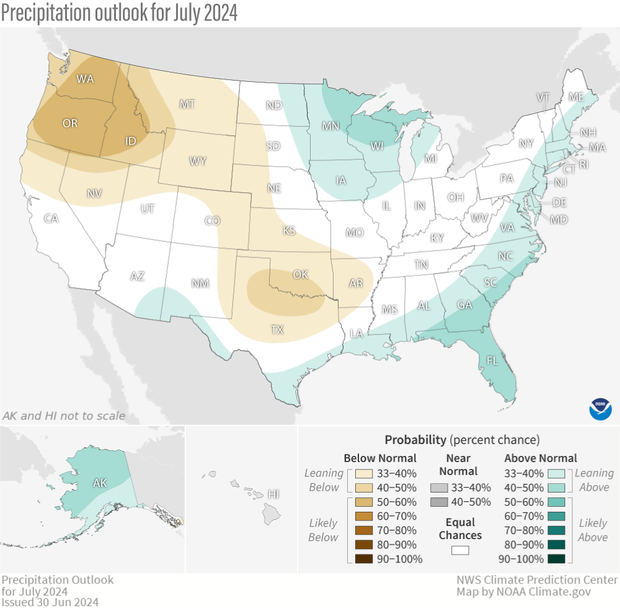
The precipitation outlook for July 2024, showing where the average precipitation (rain and snow) is favored to be much higher than average (greens), near average (gray), or much lower than average (browns). Darker colors mean higher chances, not more extreme precipitation departures. White areas mean that there are equal chances for a wet, dry, or near-average July. Much higher or much lower than average means "in the upper or lower third" of July precipitation amounts from 1991-2020. Text-only forecast for Hawaii available from NOAA Climate Prediction Center.
In addition to drilling down into the specifics about the outlooks and their basis, I’ll also discuss the current state of drought and changes in drought observed during June. And my look at the upcoming month wouldn’t be complete without my monthly reminder that the colors on the temperature and precipitation outlook maps only provide information about the most likely outcome, but other outcomes are still possible, just less likely. More details about interpreting the outlooks can be found
The updated outlooks were produced considering the Week 1 forecast from the Weather Prediction Center (WPC), and CPC’s own Week 2 and Week 3-4 outlooks. Other tools that forecasters examined this month were longer-range forecast models such as the Global Ensemble Forecast System (GEFS), the Climate Forecast System (CFSv2), and products derived from these models. With ENSO-neutral conditions now found across the tropical Pacific, El Niño was not a factor in the July outlooks. Finally, observed soil moisture was considered for these outlooks, as extremes in soil moisture (both wet and dry) can influence temperatures and precipitation during the summer.
Temperature outlook favors more heat
The July temperature outlook favors well above average temperatures across almost the entire contiguous United States. (Well above average means “in the warmest third of all Julys in the recent climate record.”) The exception is for parts of the northern Midwest from western Michigan extending westward to eastern North and South Dakota, where equal chance odds are found (1/3 chance each of below-, near-, and above-average). A large region of the nation has very high odds for the heat to continue, with probabilities exceeding 60% in large parts of the western, southern, and eastern parts of the country, and odds exceeding 70% in the Great Basin and parts of the Southwest and Intermountain West.
Underpinning this monthly outlook is the fact that most of the western, southern, and eastern parts of the country are favored to have above-normal temperatures during both the short term (WPC Week-1 forecasts) and CPC longer-term (Week-2 and Weeks 3-4 outlooks). The CPC outlooks favor above-average temperatures over the entire nation. Ridging (jet stream shifted north of normal) is predicted along the West Coast early in the month, before it moves inland later in the month, becoming centered over the Northern Rockies. Ridging is also predicted to persist throughout much of the month over the East, leading to higher confidence of heat there as well. The early part of July looks to be cooler-than-average in parts of the Northern Plains and upper Great Lakes, which could persist into Week-2. Thereafter, above-average temperatures are favored, but the moderate start to the month provides enough uncertainty that there is no tilt in the odds for the month as a whole.
Precipitation outlook is mixed bag
The precipitation outlook has a fairly large amount of the country with a non-“equal chances” forecast, but the probabilities (and therefore confidence) are fairly modest, certainly much lower than the probabilities seen in the temperature outlook. Below-average precipitation is favored in the Pacific Northwest and Northern Rockies, as the previously mentioned strong ridging favored throughout most of the month should limit precipitation at the same time it’s bringing heat. The potential ridging over this region results in the largest probabilities in the precipitation outlook, exceeding 50% in the Pacific Northwest. Odds also favor below-average rainfall in parts of the southern and central Plains, where current soil moisture anomalies are below-normal, and models predict limited moisture transport into the region throughout the month.
In contrast, probabilities for rainfall lean toward above average in the Upper Mississippi Valley, the southern borders of New Mexico and Arizona, and along the Gulf Coast, Florida, and along the East Coast. Expected rainfall early in the month contributes to the outlook in the Desert Southwest and in the Upper Mississippi Valley, while the slight tilt toward above-normal precipitation along the Gulf and Atlantic Coasts is a nod toward longer-term trends and potential tropical activity.
U. S. Drought area increases during June
After a generally hot and dry month of June, it should come as no surprise that the amount of drought increased during the month across the continuous United States, from about 12.5% at the end of May to more than 16%. What’s more concerning, however, is that the amount of the country in the DO category (abnormally dry) increased from less than 15% to almost 30%, potentially setting the stage for a large increase in drought during July. On a more positive note, the percent of the country in the two most intense categories (D3-D4, representing extreme and exceptional drought) remained at less than 1%, for the second consecutive month.
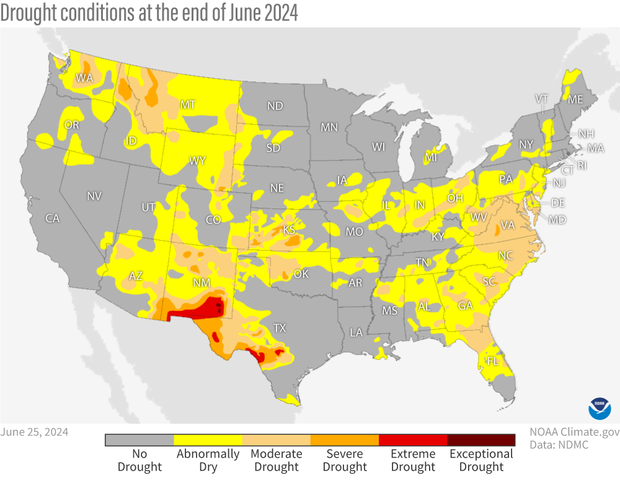
Drought conditions across the contiguous United States as of June 25, 2024. It's good news that extreme (red) and exceptional (dark red) drought was present in only small parts of New Mexico and Texas. Less good is the very large area that was abnormally dry (yellow); it may be headed toward drought, given the July temperature and precipitation outlooks. Map by NOAA Climate.gov, based on data provided by the U.S. Drought Monitor project.
Regionally, drought developed or worsened in much of the eastern part of the nation, with degradation of up to 3 classes observed. Some degradation was also observed in the parts of the northern Great Plains and scattered portions of the Southern Plains (both 1-2 classes). In contrast, drought improvement was seen over small regions of the Central and Southern Plains (1-2 classes) as well as in southern Florida (up to 3 classes). Drought throughout Florida during June was quite interesting, with the aforementioned improvement in the South, but development in the North.
Drought outlook mainly predicts persistence and significant development
With nearly 30% of the nation abnormally dry (D0) at the end of June, and a forecast favoring above-normal temperatures across most of the nation, the drought outlook for July predicts drought development across large parts of the northwestern, south-central and eastern parts of the country. These areas all saw soil moisture conditions worsen during June, and in general these regions are not expected to receive above-normal rainfall during the month, but are all favored to experience another hot summer month.
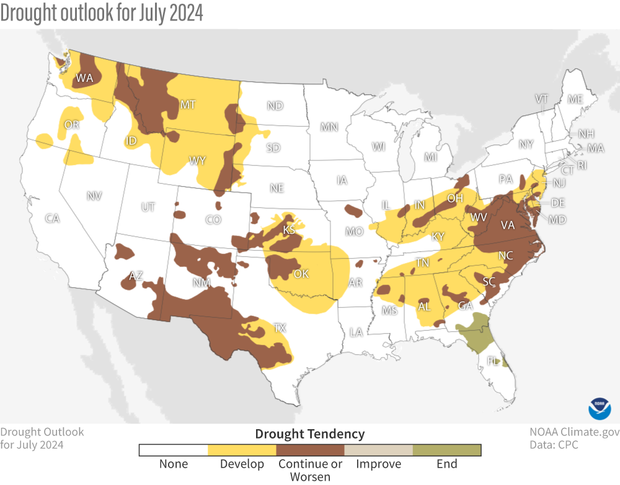
U.S. map of predicted drought changes or persistence in July 2024. Several large areas of new drought are likely (yellow), and of the existing drought areas, only a small part of Florida is likely to see improvement (green). Elsewhere drought is expected to persist or worsen (brown). NOAA Climate.gov map, based on data from the Climate Prediction Center.
Current drought in these locations is also expected to persist, if not worsen. In fact, the only area currently in drought expected to see improvement (and drought removal) is in Florida and adjacent Georgia, where a favorable precipitation forecast is coincident with a favorable time of year for soil moisture recharge.
To read the entire discussion of the monthly climate outlooks from the Climate Prediction Center, check out their website.