U.S. climate summary for August 2024
Key Points
- The average temperature of the contiguous U.S. in August was 74.0°F, 1.9°F above average; the month tied with August 1998 as the 15th warmest in the 130-year record.
- Debby made landfall as a Category 1 Hurricane on August 5 near Steinhatchee, Florida and a second landfall as a tropical storm near Bulls Bay, South Carolina on August 8. The storm brought heavy rains, flooding and strong winds to the Southeast.
- In Puerto Rico, before strengthening as a hurricane, Tropical Storm Ernesto brought significant flooding and caused nearly half of the island to lose power due to its strong winds during August 13–14.
- Rain bands and strong winds from Hurricane Hone impacted Hawaii during August 24–25, causing flooding and power outages.
- A number of cities across the West, South and East Coast each experienced their warmest summer on record.
- About 30% of the contiguous U.S. was in drought by the beginning of September, up a little over 10% from the end of July.
Temperature
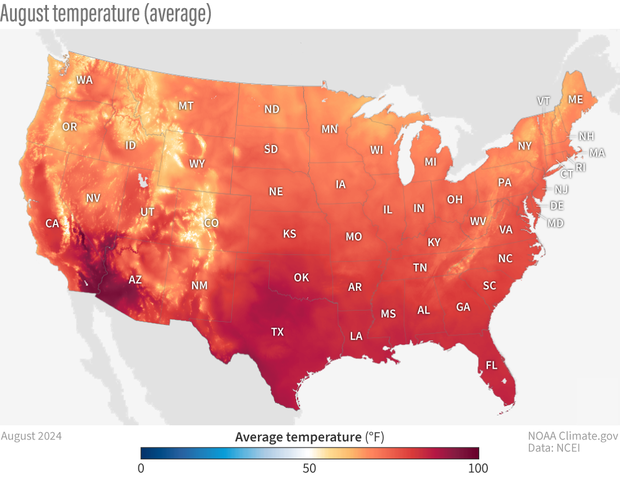
Monthly average temperatures across the contiguous United States for August 2024. Places where the August average was around 60 degrees Fahrenheit—only the high mountains of the West—are colored yellow; places where it was warmer are colored orange to dark red. NOAA Climate.gov maps from our Data Snapshots: Temperature collection, based on data from NCEI.
August temperatures were above average across the western and northeastern contiguous U.S., with near-record warmth in the southern states. Florida had its second-warmest August on record while Texas and New Mexico each had their third-warmest August on record. Conversely, near- to below-average temperatures were observed from North Dakota to the Carolinas.
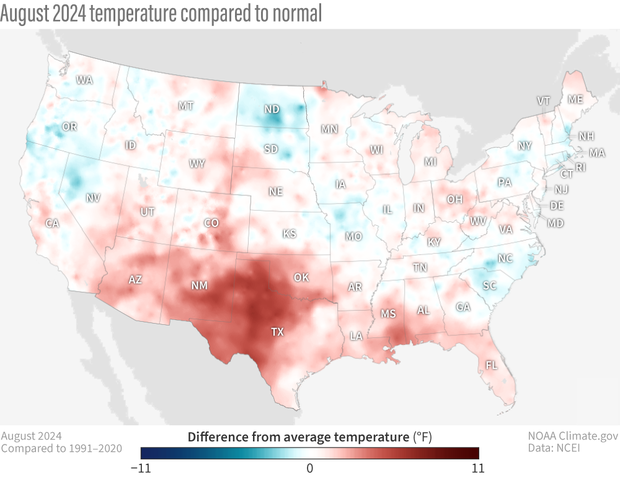
Average temperature in August 2024 compared to normal (1991-2020 average). Places that were warmer than average are red; places that were cooler than average are blue. NOAA Climate.gov maps from our Data Snapshots: Temperature collection, based on data from NCEI. Visit NCEI for climate statistics for Alaska and Hawaii.
The Alaska statewide August temperature was 49.6°F, 0.1°F above the long-term average, ranking in the middle third of the 100-year period of record for the state. Near- to cooler-than-average temperatures were observed throughout much of the state, with above-average temperatures occurring across parts of the North Slope and from the Northeast Gulf to the Panhandle.
The meteorological summer (June–August) average temperature for the contiguous U.S. was 73.8°F, 2.5°F above average, which is the fourth-warmest summer in the 130-year record. Temperatures were above average to record warm across much of the western U.S. and from the Gulf Coast to the Northeast. Arizona, California, Florida, Maine and New Hampshire each had their warmest summer on record.
The Alaska summer temperature was 51.7°F, 1.3°F above the long-term average, ranking in the warmest third of the record for the state. Temperatures were above-average across much of the state, while parts of the West Coast and Bristol Bay saw near-average summer temperatures.
For the January–August period, the average contiguous U.S. temperature was 56.9°F, 3.0°F above average, ranking second warmest on record. Temperatures were above average across the contiguous U.S., while record-warm temperatures were observed in parts of the Northeast, Ohio Valley and South. New Hampshire, Vermont and West Virginia each saw their warmest January–August period on record.
The Alaska January–August temperature was 31.2°F, 2.4°F above the long-term average, ranking in the warmest third of the historical record for the state. Most of the state was warmer than average.
Precipitation
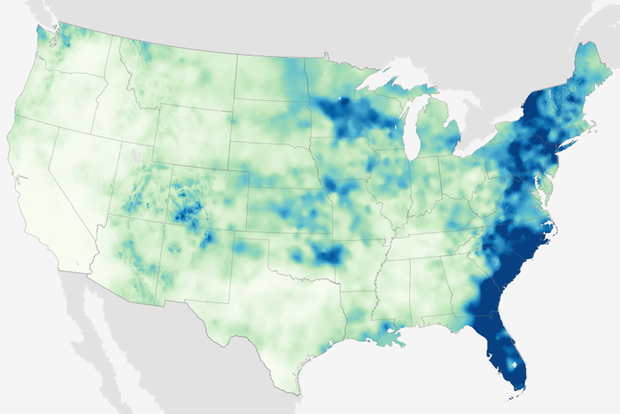
Total rain and snow across the contiguous United States for August 2024. Places where the August precipitation was less than 4 inches are colored light to medium green; places where it was more than 4 inches are colored light to dark blue. NOAA Climate.gov maps from our Data Snapshots: Precipitation collection, based on data from NCEI.
August precipitation for the contiguous U.S. was 2.46 inches, 0.16 inch below average, ranking in the driest third of the historical record. Precipitation was below average across much of the South from the southern California coast to the central Gulf Coast, extending into the Ohio Valley. Alabama and Mississippi had their driest August on record, with Tennessee ranking second driest. Conversely, precipitation was above average along the East Coast, across the central Rockies, Northern Tier states and from northern California to Washington State. New York had its fourth-wettest August on record.
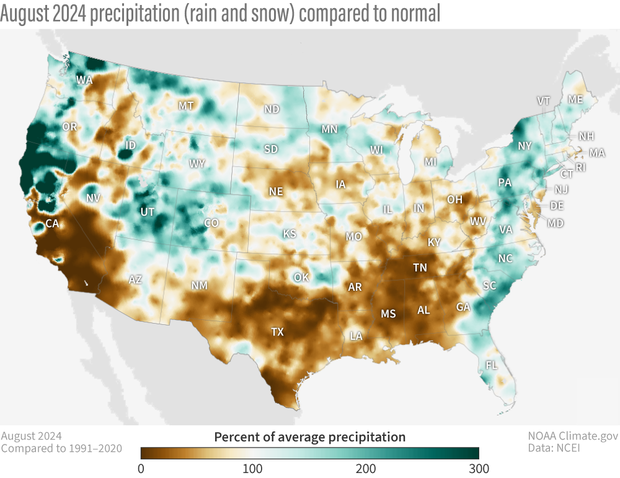
This map shows August 2024 precipitation (total rain and snow) received across the United States as percent of normal (1991-2020 average). Places where precipitation was below normal are brown; places where it was above normal are blue-green. NOAA Climate.gov maps from our Data Snapshots: Precipitation collection, based on data from NCEI. Visit NCEI for climate statistics for Alaska and Hawaii.
Alaska’s average monthly precipitation ranked in the wettest third of the historical record. Drier-than-average conditions dominated the Aleutians and central to southern Panhandle regions, while mostly above-average precipitation dominated the remainder of the state.
The U.S. summer precipitation total was near-average with a total of 8.30 inches, ranking in the middle third of the June–August record. Precipitation was above average across portions of the Upper Midwest, and in parts of the Northeast, Southeast, Gulf Coast and central Rockies. Michigan saw its fifth-wettest summer on record. Summer precipitation was below average from the Ohio Valley to the Gulf Coast, from the northern Rockies to California and across portions of the central and southern Plains. West Virginia had its fifth-driest summer on record.
For summer season precipitation, Alaska ranked in the wettest third of the record with wetter-than-average conditions observed across most of the state. Precipitation was below average in parts of the South Panhandle, Southeast Interior and the Aleutians.
The January–August precipitation total for the contiguous U.S. was 22.93 inches, 2.23 inches above average, ranking 10th wettest in the 130-year record. Precipitation was above average across a large portion of the Upper Midwest, Northeast and Deep South, with Rhode Island and Connecticut both ranking second wettest. Conversely, precipitation was below average across parts of the Northwest, northern Plains, central Appalachians and west Texas during the January–August period.
The January–August precipitation for Alaska ranked in the wettest third of the 100-year record.
Drought
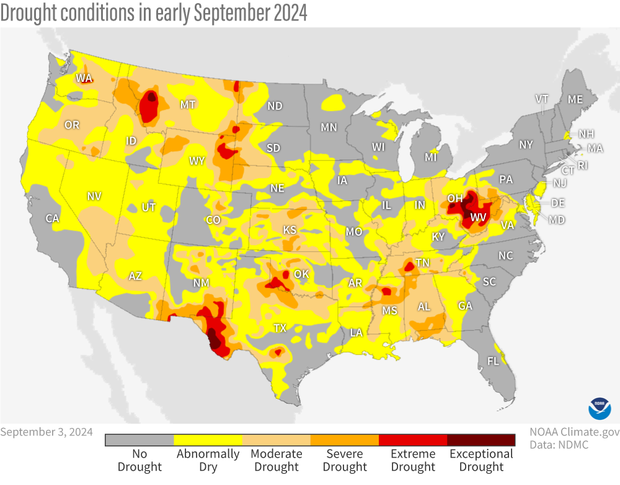
Map of drought status across the continuous United States as of September 3, 2024. A sizeable part of the country was abnormally dry (yellow) or in some level of drought (peach: moderate; orange: severe; red: extreme; dark red: exceptional). NOAA Climate.gov map from our Data Snapshots Collection, based on data from the U.S. Drought Monitor project.
According to the September 3 U.S. Drought Monitor report, about 30% of the contiguous U.S. was in drought, up a little over 10% from the end of July. Drought or abnormally dry conditions expanded or intensified this month across much of the Deep South, Great Plains and Tennessee and Ohio Valleys, and in the Great Basin to California and in the interior Pacific Northwest. Parts of West Virginia and Ohio experienced exceptional drought for the first time in the 25-year U.S. Drought Monitor history. Drought contracted or was reduced in intensity across much of Hawaii and the Mid-Atlantic, and parts of the Northeast, West and Central Plains.
For more information on August and year-to-date climate, including billion-dollar disasters and other extreme events, see NOAA's monthly summary for August 2024.