U.S. climate summary for July 2024
Key Points
- The average temperature of the contiguous U.S. in July was 75.7°F, 2.1°F above average, ranking 11th warmest in the 130-year record.
- The Park Fire is the fourth-largest wildfire in California history as of August 6; beginning on July 24, it burned approximately 401,000 acres and destroyed over 560 structures.
- On July 15, a derecho that spawned 32 tornadoes broke the Chicago-area record for most tornadoes in a day.
- On July 1, Beryl became the earliest Category 5 hurricane and the second Category 5 on record during the month of July in the Atlantic Ocean.
- Alaska had its wettest July on record.
- Four new Billion-Dollar Weather and Climate Disasters were confirmed in July. The year-to-date total currently stands at 19 disasters.
Temperature highlights
July temperatures were above average to record warm across much of the western and eastern contiguous U.S.: California and New Hampshire each had their warmest July on record with 19 additional states seeing their top 10 warmest July on record.
Grab and drag slider to compare average temperature for July 2024 (left) to what's normal for July (right) based on data from 1991-2020. Places where the July average was around 60 degrees Fahrenheit—only the high mountains of the West—are colored yellow; places where it was warmer are colored orange to dark red. NOAA Climate.gov maps from our Data Snapshots: Temperature collection, based on data from NCEI.
The Alaska statewide July temperature was 52.8°F, 0.1°F above the long-term average, ranking in the middle third of the 100-year period of record for the state. Near-average temperatures were observed throughout most of the state, with above-average temperatures observed across much of the Northeast Gulf, Aleutians and South Panhandle.
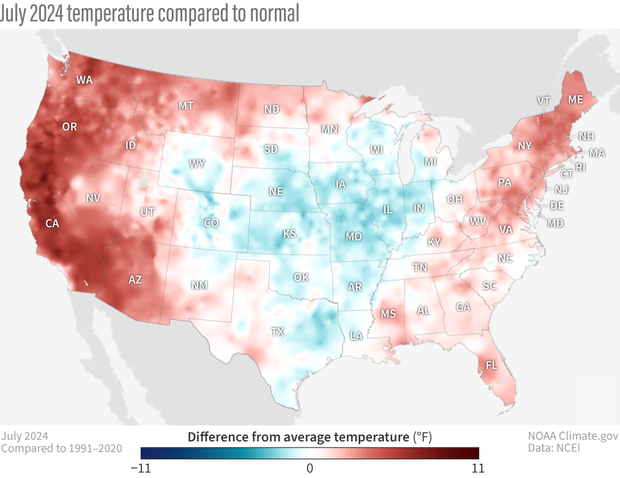
Average temperature in July 2024 compared to normal (1991-2020 average). Places that were warmer than average are red; places that were cooler than average are blue. Warmer-than-average temperatures in the West and the East are like a set of parentheses around a pocket of cooler-than-average temperatures in the country's center. NOAA Climate.gov maps from our Data Snapshots: Temperature collection, based on data from NCEI. Visit NCEI for climate statistics for Alaska and Hawaii.
For the January–July period, the average contiguous U.S. temperature was 54.5°F, 3.2°F above average, ranking second warmest on record. Temperatures were above average across nearly all of the contiguous U.S., while record-warm temperatures were observed in parts of the Northeast, Great Lakes, southern Plains and Mid-Atlantic. New Hampshire and Vermont both saw their warmest January–July period on record. An additional 25 states had a top-five warmest year-to-date period. All states ranked in the warmest third of the historical record during this seven-month period.
The Alaska January–July temperature was 28.6°F, 2.8°F above the long-term average, ranking in the warmest third of the historical record for the state—much of the state was warmer than average while temperatures were near average across parts of the Panhandle.
Precipitation highlights
July precipitation for the contiguous U.S. was 3.04 inches, 0.26 inch above average, ranking in the wettest third of the historical record. Precipitation was below average across much of the West and Rockies, eastern parts of the Ohio Valley to the Mid-Atlantic, southern Florida and across portions of the Plains. West Virginia had its eighth-driest July on record. Conversely, precipitation was above average across much of the South, Southeast, Midwest, Great Lakes and northern New England. Illinois had its seventh wettest July, while North Carolina had its eighth wettest.
Grab and drag slider to compare total precipitation (rain and snow) for July 2024 (left) to what's normal for July based on data from 1991-2020 (right). Places where the July precipitation was less than 4 inches are colored light to medium green; places where it was more than 4 inches are colored light to dark blue. NOAA Climate.gov maps from our Data Snapshots: Precipitation collection, based on data from NCEI.
Alaska’s average monthly precipitation ranked wettest in the historical record. Much of the state was wetter than average for the month of July, with the Central Interior having its wettest July on record and the North Slope, West Coast and Northeast Interior each experiencing their second wettest July.
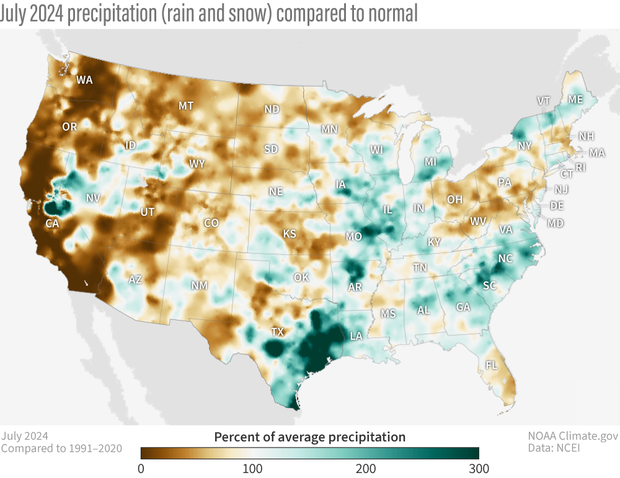
This map shows July 2024 precipitation (total rain and snow) received across the United States as percent of normal (1991-2020 average). Places where precipitation was below normal are brown; places where it was above normal are blue-green. NOAA Climate.gov maps from our Data Snapshots: Precipitation collection, based on data from NCEI. Visit NCEI for climate statistics for Alaska and Hawaii.
The January–July precipitation total for the contiguous U.S. was 20.44 inches, 2.36 inches above average, ranking 11th wettest in the 130-year record. Precipitation was above average across a large portion of the Upper Midwest, Northeast and Deep South, with Rhode Island, Minnesota and Wisconsin each ranking second wettest. Conversely, precipitation was below average across parts of the Northwest, northern Plains and west Texas during the January–July period.
The January–July precipitation for Alaska ranked in the wettest third of the 100-year record, with below-average precipitation observed across parts of the Cook Inlet, Aleutians and South Panhandle regions, near-average precipitation in the Northeast, Central and Southeast Interior regions and above-average precipitation observed across the remaining climate divisions.
Billion-dollar disasters
Four new billion-dollar weather and climate disasters were confirmed in July 2024, including one severe weather event that impacted the southern U.S. in mid-May, New Mexico wildfires during June and July, one severe weather event that impacted the central and northeastern U.S. (June 24–26) and Hurricane Beryl (July 8–9).
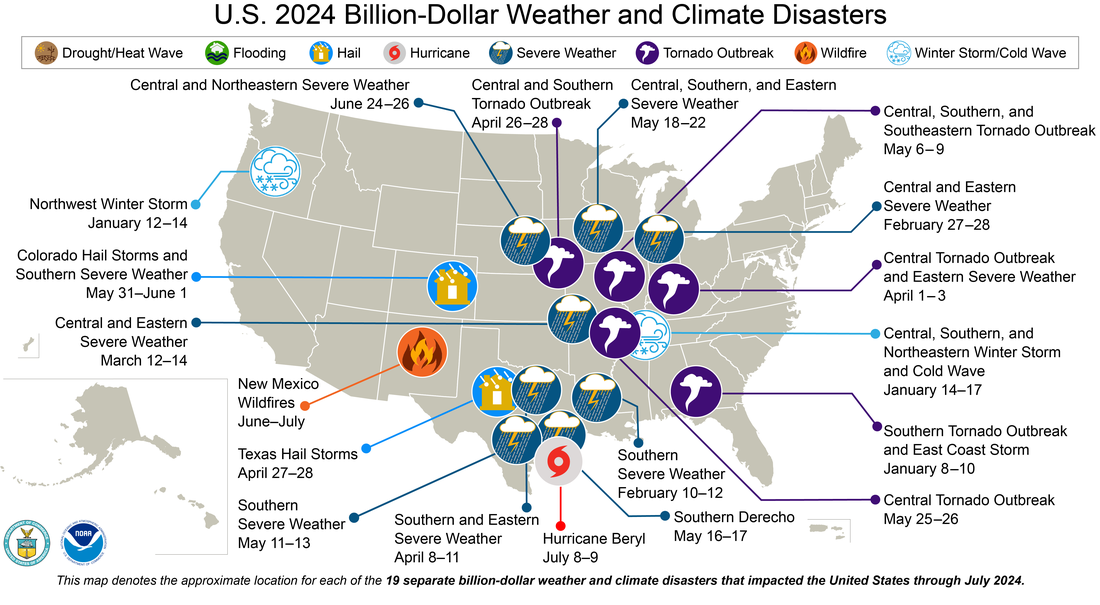
Through July 2024, the United States has experienced 19 disasters totaling at least 1 billion dollars in damages. NOAA image from National Centers for Environmental Information.
There have been 19 confirmed weather and climate disaster events this year, which is second only to 2023 for the highest amount for the first seven months of the year, each with losses exceeding $1 billion. These disasters consisted of 15 severe storm events, one tropical cyclone event, one wildfire event and two winter storms. The total cost of these events exceeds $49.6 billion, and they have resulted in at least 149 fatalities.
The U.S. has sustained 395 separate weather and climate disasters since 1980 where overall damages/costs reached or exceeded $1 billion (including CPI adjustment to 2024). The total cost of these 395 events exceeds $2.770 trillion.
Other Notable Events
On July 2–3, the Thompson Fire caused over 13,000 people to evacuate around Oroville, California.
Hurricane Beryl made landfall near Matagorda, Texas on July 8, causing significant damage, numerous power outages and eight fatalities.
The Shreveport NWS issued 67 tornado warnings, the most in a single day on July 8 for this office, due to the remnants of Hurricane Beryl.
On July 17, Washington D.C. hit 101ºF, tying a record for the longest streak of temperatures above 100ºF with four consecutive days.
An early July heat wave brought all-time record-breaking temperatures to portions of the West during July:
- Palm Springs, California: 124ºF on July 5
- Las Vegas, Nevada: 120ºF on July 7
- Redding, California: 119ºF on July 6
- Barstow, California: 118ºF on July 7 and 8
- Palmdale, California: 115ºF on July 6
Drought
According to the July 30 U.S. Drought Monitor report, about 20% of the contiguous U.S. was in drought, up a little over 1% from the end of June. Drought or abnormally dry conditions expanded or intensified this month across much of the West and Hawaii, and parts of the Central and Northern Plains, the Ohio Valley, the central Appalachians, Tennessee and the Northeast. Drought contracted or was reduced in intensity across much of the Southeast, western portions of the Ohio Valley and parts of Arkansas and Texas.
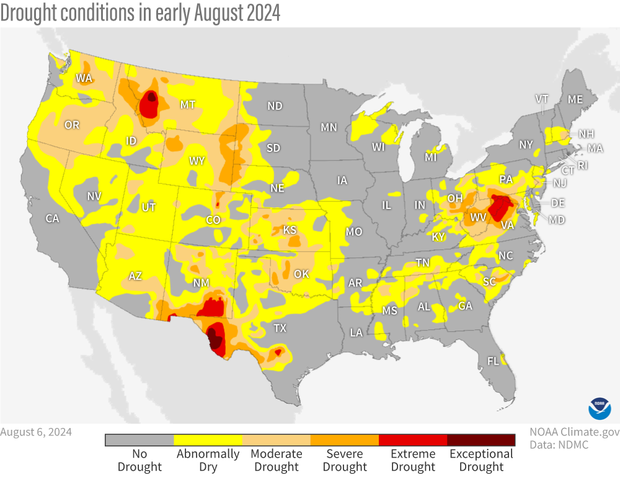
Map of drought status across the continuous United States as of August 6, 2024. Although not officially in drought, a sizeable part of the country was abnormally dry (yellow), including most of the West and along an arc tracing out the Southern and Central Appalachian Mountains from Alabama to Pennsylvania. NOAA Climate.gov map from our Data Snapshots Collection, based on data from the U.S. Drought Monitor project.
Monthly Outlook
Above-average temperatures are favored to impact areas across the western and southeastern portions of the U.S. in August, while below-average precipitation is likely to occur in the Northwest and south-central Plains. Drought is likely to persist in the Northwest, Central Plains and Hawaii. See Mike Halpert's post about the Climate Prediction Center's U.S. climate outlook for August 2024.
This monthly summary from NOAA’s National Centers for Environmental Information is part of the suite of climate services NOAA provides to government, business, academia and the public to support informed decision-making. For more detailed climate information, check out our comprehensive July 2024 U.S. Climate Report scheduled for release on August 13, 2024. For additional information on the statistics provided here, visit the Climate at a Glance and National Maps webpages.