U.S. climate summary for June 2022
Highlights from Assessing the U.S. Climate in June 2022
The average temperature of the contiguous U.S. in June was 70.7°F, which is 2.2°F above average, ranking 15th warmest in the 128-year record. Temperatures across much of the southern half of the Lower 48 as well as from the northern Plains to the Ohio Valley were above average.
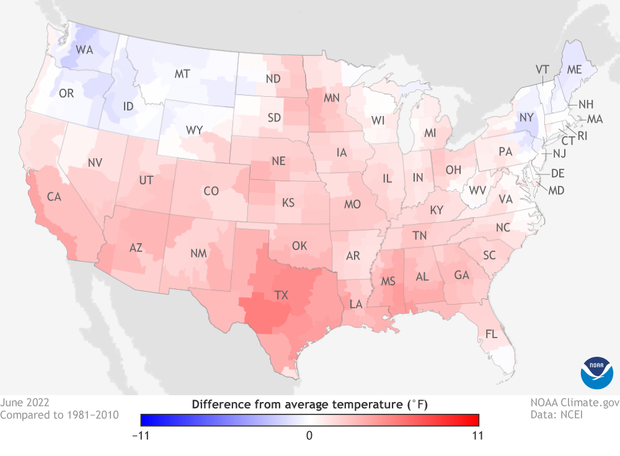
Temperatures across the contiguous United States in June 2022 compared to the 1981-2010 average. Nearly the entire country was warmer than average (red), with pockets of cooler-than-average temperatures (blue) only in the Pacific Northwest and the Northeast. Map from Climate.gov's Data Snapshots collection, based on data from NOAA National Centers for Environmental Information.
Above-average warmth, associated with a ridge of high pressure, dominated much of the contiguous U.S. during June. Several Southern Tier states had a top-10 warmest June on record including Texas, ranking fifth warmest on record for the month. This is the third consecutive month of extreme heat across Texas, which resulted in a ranking of warmest on record for the April-June period.
Integrated across the state, precipitation across Alaska ranked driest on record for June and was 0.04 inch less than the previous record set in 1934. June precipitation for the contiguous U.S. was 2.33 inches, 0.60 inch below average, tying with 1930 for 12th driest in the historical record. Precipitation was above average across portions of the Northwest and Southwest. Precipitation was below average in the Great Basin, from the central Rockies to the Great Lakes, across the Deep South and from the mid-Mississippi Valley to the Southeast.
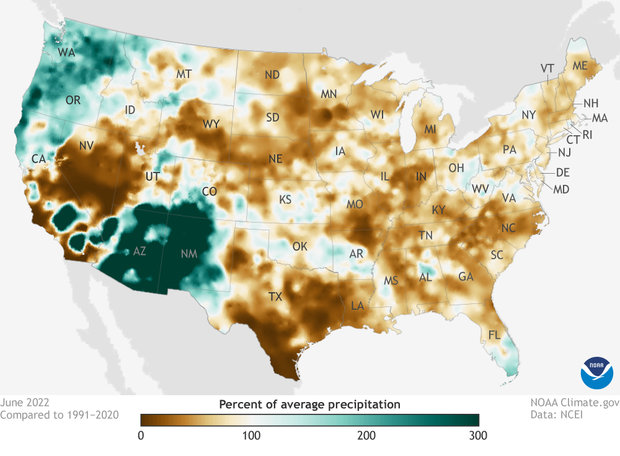
Percent of average June precipitation in 2022 compared to the 1981-2010 average. The start of the wet phase of the North American Monsoon was strong, bringing parts of the Southwest precipitation that was 200 percent or more above average (dark green). Meanwhile, much of the rest of the contiguous United States received less than 100 percent of their average June precipitation (brown). Map from Climate.gov's Data Snapshots collection, based on data from NOAA National Centers for Environmental Information.
The Pacific Northwest received above average precipitation in June associated with multiple atmospheric river events during the first half of the month and the Southwest received an abundance of precipitation associated with the return of the monsoon season during the second half of June. New Mexico ranked fifth wettest on record. Washington and Oregon ranked seventh and eighth wettest on record, respectively. A dominant ridge of high pressure across the central and eastern U.S. resulted in below-average precipitation totals for the month. North Carolina ranked second driest on record for June and Nebraska seventh driest.
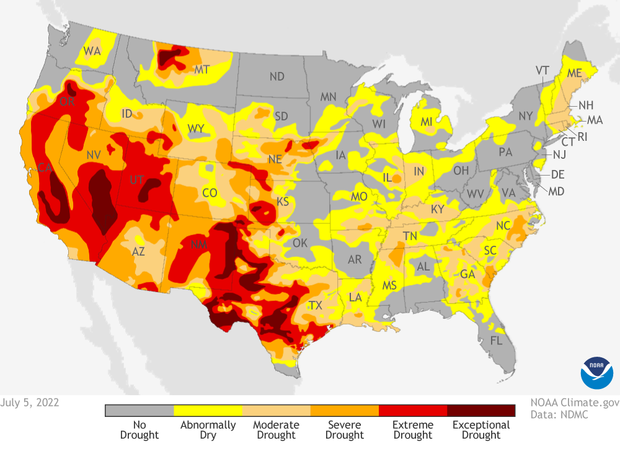
U.S. area affected by abnormal dryness (yellow) or some level of drought from moderate (light orange) to exceptional (dark red) in early July 2022. Map from Climate.gov's Data Snapshots collection, based on data from the National Drought Monitor Project.
According to the June 28 U.S. Drought Monitor report, 47.7 percent of the contiguous U.S. was in drought, down about 1.5 percentage points from the end of May, but up 2.4 percent in the last week of June. Drought intensified and/or expanded across the Deep South, Southeast and New England and erupted across portions of the mid-Mississippi and Ohio Valleys. Monsoon rains helped to lessen the drought intensity across parts of the Southwest. Several atmospheric river events aided drought reduction and/or elimination in portions of the Pacific Northwest and the northern Rockies. Drought expanded across Alaska and Puerto Rico and contracted across the Big Island of Hawaii during June.
The wildfire season continues as large fires burn across portions of the South and Southwest and have grown rapidly across Alaska. Across all 50 states, more than 3.9 million acres have burned from January 1 through June 30 — nearly 2.3 times the average for this time of year.
For more highlights from the U.S. climate report for June, including year-to-date statistics for billion-dollar disasters, and other extreme events, read Assessing the U.S. climate in June 2022.