U.S. climate summary for May 2021
For May, the average contiguous U.S. temperature was 60.4°F, 0.2°F above the 20th-century average, ranking in the middle third of the 127-year record. The meteorological spring (March-May) average temperature for the Lower 48 was 52.6°F, 1.7°F above average, ranking in the warmest third of the record. Averaged over the first five months of the year, the contiguous U.S. temperature was 44.6°F, 1.3°F above the 20th-century average, ranking in the warmest third of the January-May record.
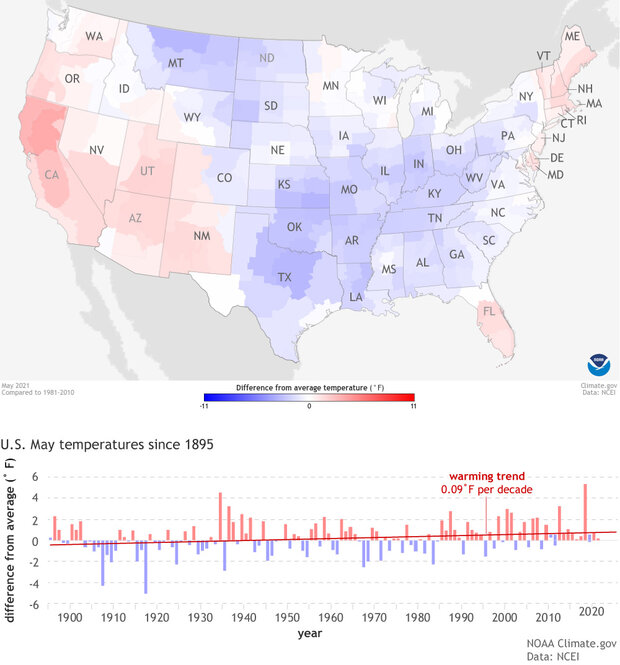
(top) Average temperature for the contiguous United States in May 2021 compared to the twentieth-century average. Places that were cooler than average are red; places that were cooler than average are blue. (bottom) May temperature compared to the twentieth-century average each year from 1895–2021. U.S. May temperature has risen by 0.09 degrees Fahrenheit per decade. NOAA Climate.gov image, based on data from NCEI.
The May precipitation total for the contiguous U.S. was 2.94 inches, 0.03 inch above average, ranking in the middle third of the 127-year period of record. The spring precipitation total was 7.53 inches, 0.41 inch below average, ranking in the driest third of the March-May record and was the driest spring since 2006. The year-to-date precipitation total was 11.65 inches, 0.74 inch below average, ranking in the driest third of the 127-year record. This was the driest such year-to-date period since 2012.
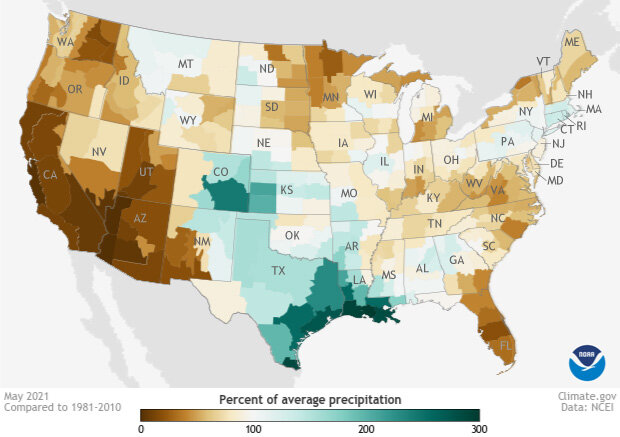
Percent of average precipitation for May 2021 across the contiguous United States. Places that received less than 100 percent of their average precipitation are brown. Places that received more than 100 percent of their average precipitation are blue-green. NOAA Climate.gov map, based on data from NCEI.
According to the June 1 U.S. Drought Monitor report, 43.7 percent of the contiguous U.S. was in drought, down about 4.7 percent from the end of April. Drought intensified and/or expanded across California, Oregon, Washington, the northern Plains, parts of the Great Lakes and across Puerto Rico and Hawaii. Drought emerged across portions of the eastern Carolinas and Virginia. Drought severity lessened across portions of the Rocky Mountains and Northeast and drought was mostly eliminated across the central and southern Plains.
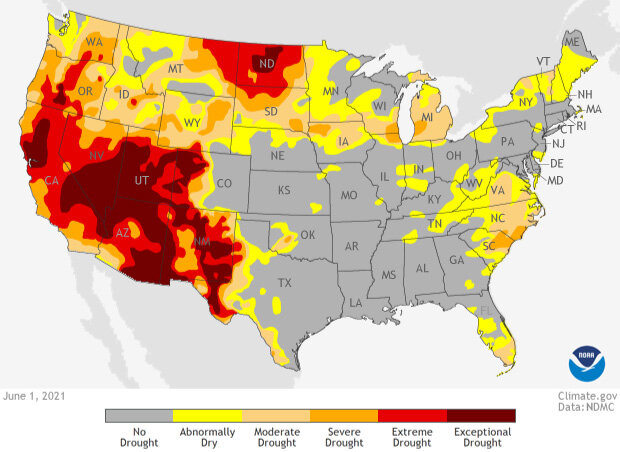
Drought status across the contiguous United States as of June 1, 2021. A large portion of the West was experiencing drought, and in the Southwest, experts ranked the drought as "exceptional,"—the worst drought category. NOAA Climate.gov image, based on data from U.S. Drought Monitor Project.
For more climate statistics and information, including the spring summary, visit the National Centers for Environmental Information's State of the Climate page. Want to know what's on the horizon for June? Read our post on the Climate Prediction Center's June 2021 outlook for temperature, precipitation, and drought.