Was May 2020 warm and dry or cool and wet across the U.S.? It depends…
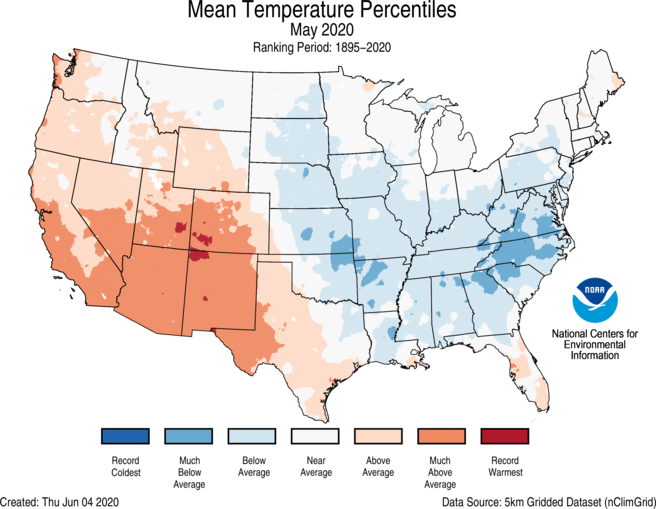
The May 2020 climate summary for the United States was released yesterday by NOAA’s National Centers for Environmental Information, and the temperature patterns were mixed: a warm West and cool East. In the Four Corners region, a few areas were record warm. In the East, temperatures were much cooler than average in the Southern Appalachians in southwestern Virginia, the Carolinas, and northern Georgia.
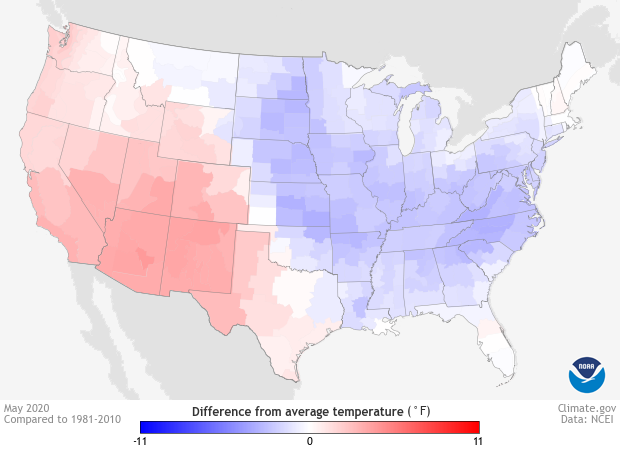
Map of May temperatures across the United States compared to the 1981-2010 average. Much of the West was warmer than average (red), while much of the East was cooler than average (blue). Map from Climate.gov's Data Snapshots collection, based on data from NCEI.
The bigger stories in May were about extremes of precipitation—where it fell heavily and caused flooding, and where it didn’t, contributing to drought. Among the big events was an atmospheric river that flowed between the Gulf of Mexico to the Great Lakes in mid-May, supplying tremendous amounts of warm, wet air to the Upper Midwest. In Michigan, several days of heavy rain ended with the collapse of a dam and the evacuation of thousands of downstream residents.
The moisture was swept up in a low-pressure system that got cut off from the wider west-to-east atmospheric flow. This cut-off low meandered generally southeast, soaking parts of the Ohio Valley and the Appalachians of West Virginia and the Carolinas over several days. Many parts of the region experienced above or much above normal precipitation.
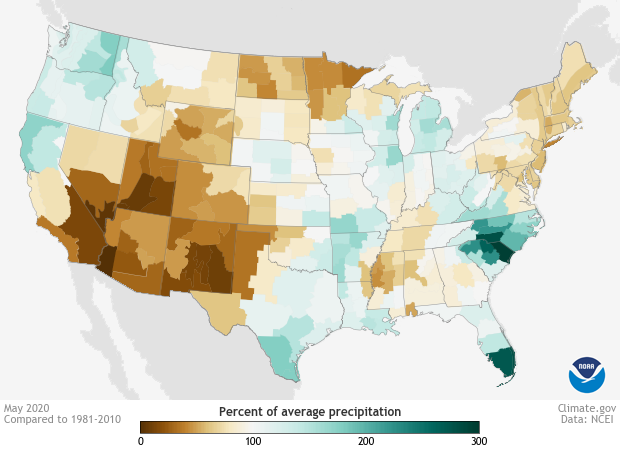
Map of May precipitation across the United States as a percent of the 1981-2010 average. Much of the West had less than 100% of their normal precipitation (brown), while much of the East had more than 100% of their normal May precipitation (green). Map from Climate.gov's Data Snapshots collection, based on data from NCEI.
May precipitation was also above average around the Gulf Coast, with some areas record or near record wet. Among the extremes was southern Florida, where rainfall associated with Tropical Storm Bertha contributed to Miami’s wettest May on record. (Also noteworthy: May 2020 was a record sixth May in a row in which the first named storm of the Atlantic Hurricane Season formed before the official start of the season on June 1.)
While an extreme event can happen in any month regardless of climate change, it’s also the case that heavy rain events are becoming more likely across much of the country. As rising levels of atmospheric carbon dioxide boost Earth's surface temperature, more water evaporates from the ocean and land surfaces. A wetter atmosphere has the potential to make more rain during a given event. According to the National Climate Assessment, it’s a trend that will continue in the coming decades, even if greenhouse gas emissions follow a lower pathway.
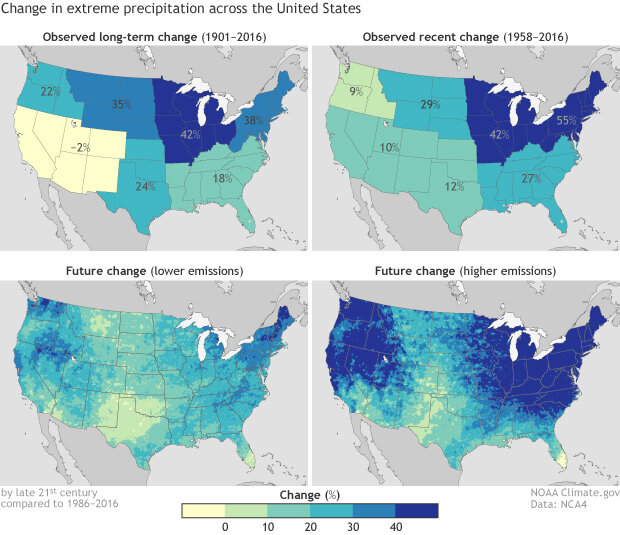
These maps show observed (top row) and predicted (bottom row) changes in extreme precipitation in the United States. Bigger increases appear in darker colors.
Meanwhile, May 2020 precipitation was below or much below average across large areas of the Rockies and the Southwest, including northern Texas. Southern California and the southwestern corner of Arizona were record dry. May precipitation deficits allowed drought conditions to deepen across Nevada, Utah, Colorado, northern New Mexico, and western Oklahoma and northern Texas. Moderate drought also emerged in North Dakota and Minnesota. The total area in the contiguous United States experiencing some level of drought rose to just shy of 20% in May.
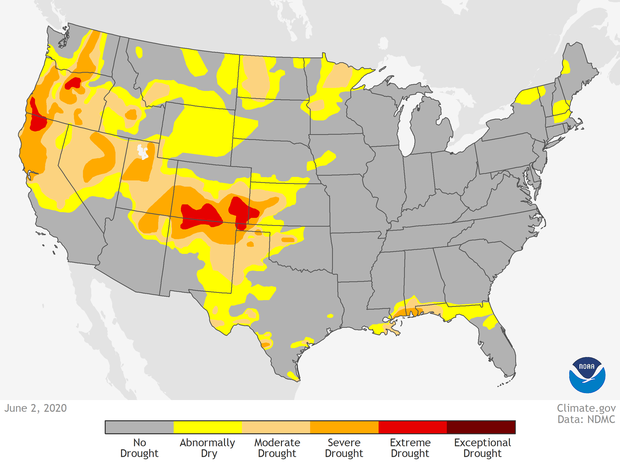
Areas of the contiguous United States affected by drought as of June 2, 2020. Moderate to extreme drought stretched across many Western states. Map from Climate.gov's Data Snapshots collection, based on data from the U.S. Drought Monitor project.
For more details on the May 2020 and spring climate summary for the United States, visit the NCEI website. For more information on the impacts of climate change across the United States, browse the Fourth National Climate Assessment by the U.S. Global Change Research Program.