2016-2017 U.S. Winter Outlook
Mike Halpert of NOAA's Climate Prediction Center talks about La Niña and other climate patterns that are likely to influence winter climate across the United States. NOAA Climate.gov video by Ned Gardiner, Alicia Albee, Kurt Mann, Robert Klein, and Bruce Sales.
Details
NOAA Press release
Forecasters at NOAA’s Climate Prediction Center issued the U.S. Winter Outlook today, saying that La Nina is expected to influence winter conditions this year. The Climate Prediction Center issued a La Nina watch this month, predicting the climate phenomenon is likely to develop in late fall or early winter. La Nina favors drier, warmer winters in the southern U.S and wetter, cooler conditions in the northern U.S. Read the whole press release.
Maps
Clicking on the maps will show a larger version that includes Alaska and Hawaii.
Temperature Outlook
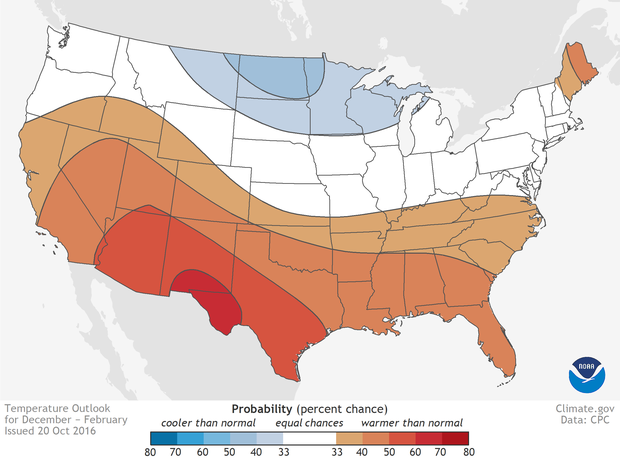
Outlook for average winter temperature across the United States (large version shows Alaska and Hawaii) for December 2016–February 2017. Anywhere in the United States, there is always a chance that the average winter temperature will be near average, well above average, or well below average. White areas show places where the odds for all three possible outcomes are equal (33%). Colored areas show where—and by how much—the odds favor well above average (reds) or well below average (blues) temperatures. "Well above" and "well below" mean "in the upper or lower third of the climatological record." NOAA Climate.gov map based on NWS Climate Prediction Center data.
Precipitation Outlook
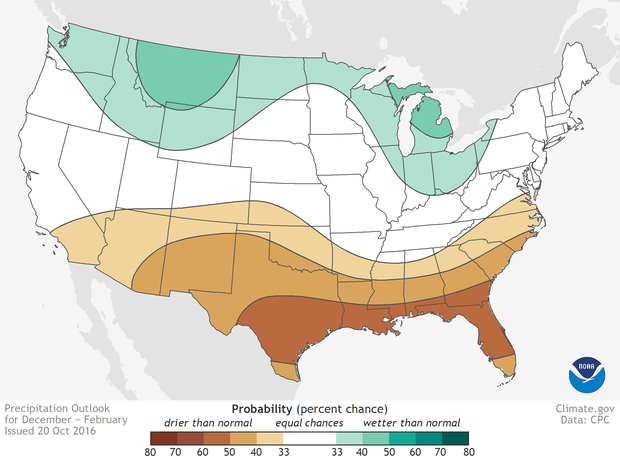
Outlook for average winter precipitation the United States (large version shows Alaska and Hawaii) for December 2016–February 2017. Anywhere in the United States, there is always a chance that the average winter precipitation will be near average, well above average, or well below average. White areas show places where the odds for all three possible outcomes are equal (33%). Colored areas show where—and by how much—the odds favor well above average (greens) or well below average (browns) precipitation. "Well above" and "well below" mean "in the upper or lower third of the climatological record." NOAA Climate.gov map based on NWS Climate Prediction Center data.
Drought Outlook
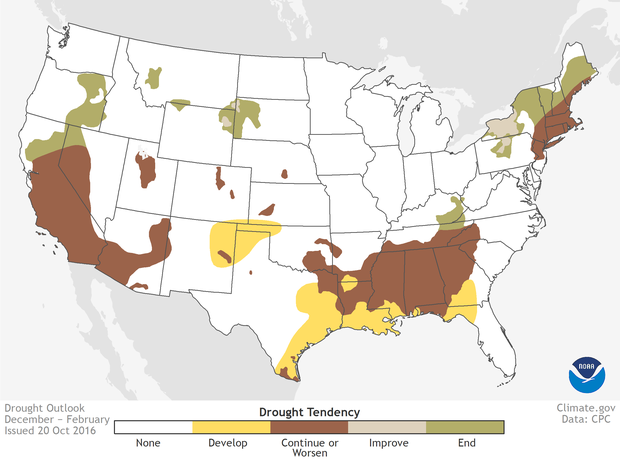
Drought outlook for the 2016-2017 winter (December-February) in the United States. NOAA Climate.gov map based on NWS Climate Prediction Center data.
Tropical Pacific sea surface temperature patterns
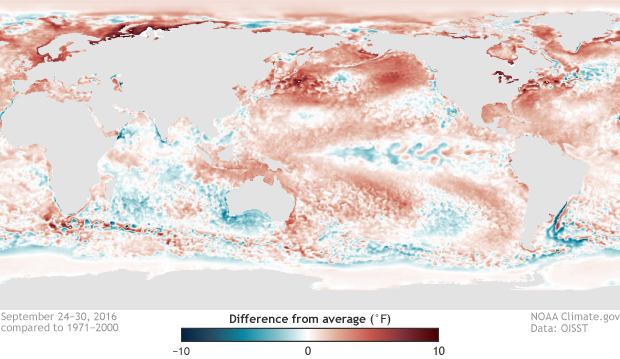
Difference from average sea surface temperatures in the Pacific Ocean in late September 2016, from the animation sequence in the 2016-17 Winter outlook video above. The frames for the entire sequence are available as a zip file. Each image represents the average anomaly for the previous seven days, inclusive of the day indicated in the time stamp in the image name. For example, the file with 20160807 in the name is the seven-day average of the data from August 1-7. NOAA Climate.gov map based on OISST daily data.