The Climate Prediction Center's Mike Halpert explains NOAA's 2017-18 winter outlook
2 min, 28 sec
Mike Halpert of NOAA's Climate Prediction Center explains what parts of the United States are favored to experience unusually high or low winter temperature or precipitation in 2017-18.
Details
Temperature outlook for 2017-18
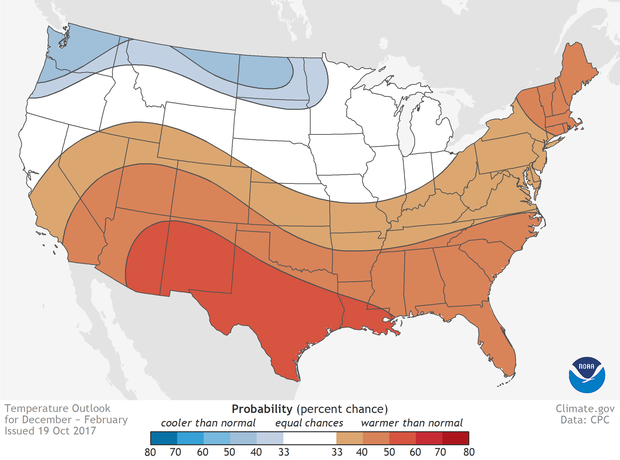
Places where the forecast odds favor a much colder than usual winter (blue colors) or much warmer than usual winter (red), or where the probability of a cold winter, a warm winter, or a near-normal winter are all equal (white). The darker the color, the stronger the chance of that outcome (not the bigger the departure from average). Click image for version that includes Alaska and Hawaii. NOAA Climate.gov map, based on data from NOAA CPC.
Precipitation Outlook for winter 2017-18
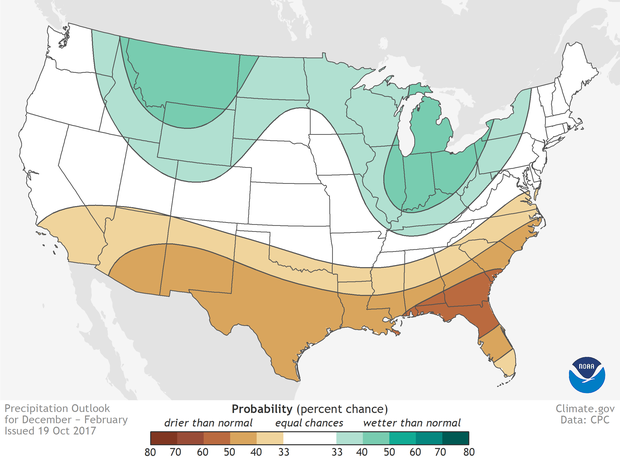
Places where the forecast odds favor a much drier than usual winter (brown colors) or much wetter than usual winter (blue-green), or where the probability of a dry winter, a wet winter, or a near-normal winter are all equal (white). The darker the color, the stronger the chance of that outcome (not the bigger the departure from average). Click image for version that includes Alaska and Hawaii. NOAA Climate.gov map, based on data from NOAA CPC.
Drought outlook for winter 2017-18
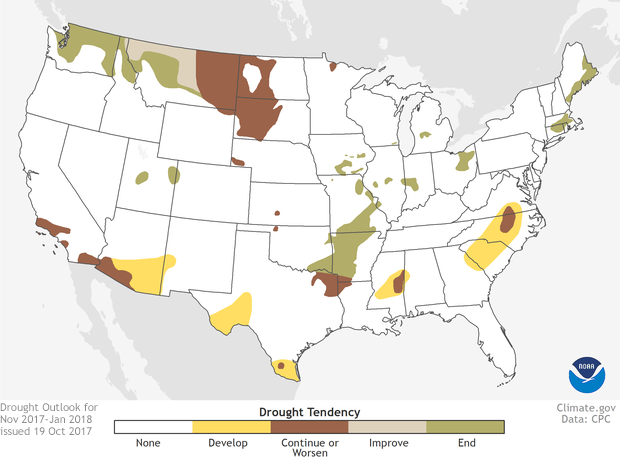
Places where the forecast favors drought development or continuing (yellow, brown) or drought improvement or ending (tan, green). Click image for version that includes Alaska and Hawaii. NOAA Climate.gov map, based on data from NOAA CPC.