U.S. Winter Outlook: Warmer, drier South with ongoing La Niña
This animation scrolls through NOAA's 2022-23 U.S. Winter Outlook maps. The first two show which parts of the country have the highest chances for a much wetter or drier than average winter and a much cooler or warmer than average winter. The third map shows the projected changes in drought conditions through the end of January 2023, and the final map shows drought conditions as of October 20. NOAA Climate.gov animation, based on data from NOAA Climate Prediction Center.
Details
This year La Niña returns for the third consecutive winter, driving warmer-than-average temperatures for the Southwest and along the Gulf Coast and eastern seaboard, according to NOAA’s U.S. Winter Outlook released today by the Climate Prediction Center—a division of the National Weather Service. Starting in December 2022 through February 2023, NOAA predicts drier-than-average conditions across the South with wetter-than-average conditions for areas of the Ohio Valley, Great Lakes, northern Rockies and Pacific Northwest.
“Drought conditions are now present across approximately 59% of the country, but parts of the Western U.S and southern Great Plains will continue to be the hardest hit this winter,” said Jon Gottschalck, chief, Operational Prediction Branch, NOAA’s Climate Prediction Center. “With the La Niña climate pattern still in place, drought conditions may also expand to the Gulf Coast.”
Temperature
- The greatest chance for warmer-than-average conditions are in western Alaska, and the Central Great Basin and Southwest extending through the Southern Plains.
- Warmer-than-average temperatures are also favored in the Southeastern U.S. and along the Atlantic coast.
- Below-normal temperatures are favored from the Pacific Northwest eastward to the western Great Lakes and the Alaska Panhandle.
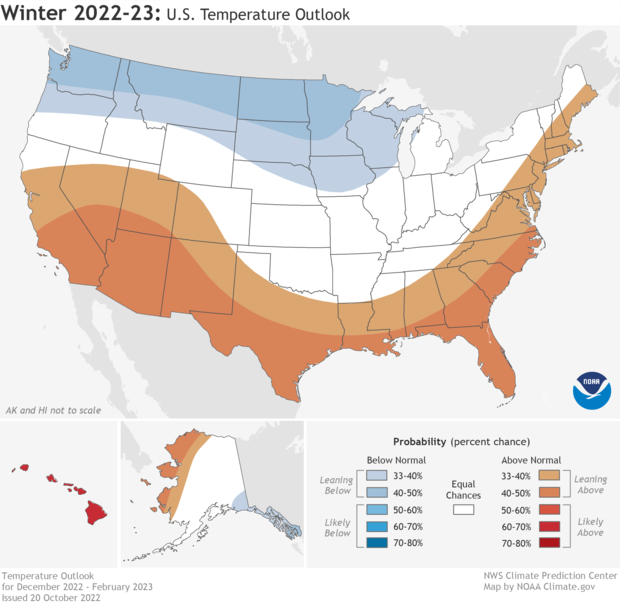
NOAA's winter temperature outlook map shows which parts of the United States have elevated chances of either a much cooler than average winter (orange and red) or a much cooler than average winter (blue). The darker the color, the higher the chance of that outcome. White areas mean that a relatively warm, cool, or average winter are all equally likely. NOAA Climate.gov map, based on data from the Climate Prediction Center.
Precipitation
- Wetter-than-average conditions are most likely in western Alaska, the Pacific Northwest, northern Rockies, Great Lakes and Ohio Valley.
- The greatest chances for drier-than-average conditions are forecast in portions of California, the Southwest, the southern Rockies, southern Plains, Gulf Coast and much of the Southeast.
- The remainder of the U.S. falls into the category of equal chances for below-, near-, or above-average seasonal total precipitation.
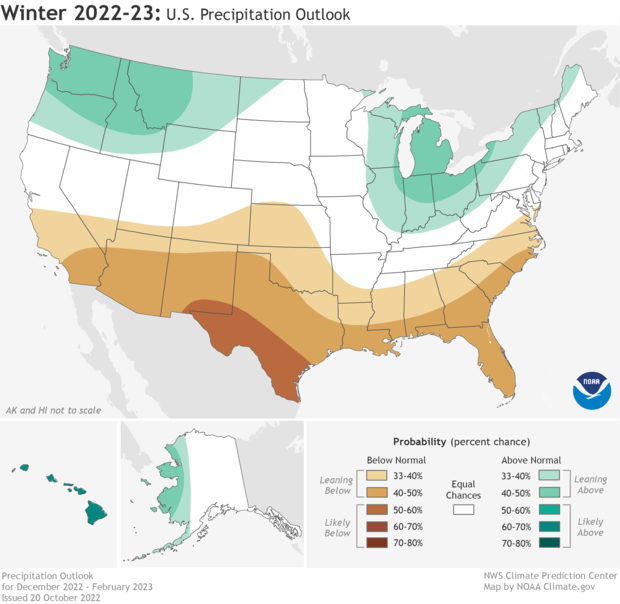
NOAA's winter precipitation outlook map shows which parts of the United States have elevated chances of either a much wetter than average winter (blue-green) or a much drier than average winter (brown). The darker the color, the higher the chance of that outcome. White areas mean that a relatively wet, dry, or average winter are all equally likely. NOAA Climate.gov map, based on data from the Climate Prediction Center.
Drought
- Widespread extreme drought continues to persist across much of the West, the Great Basin, and the central-to-southern Great Plains.
- Drought is expected to impact the middle and lower Mississippi Valley this winter.
- Drought development is expected to occur across the South-central and Southeastern U.S., while drought conditions are expected to improve across the Northwestern U.S. over the coming months.
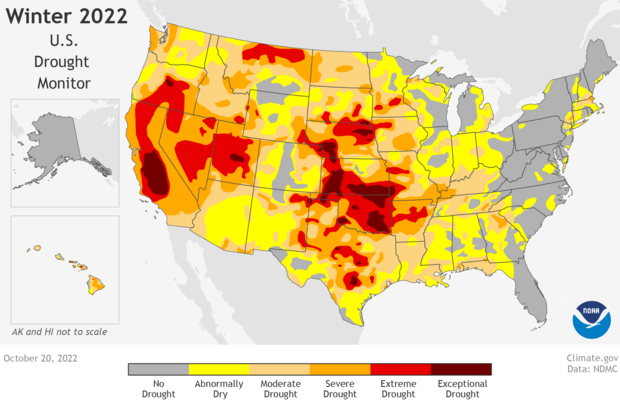
Drought status across the United States as of October 20, 2022. Much of the country is either unusually dry (yellow) or else in same level of drought (orange, red, and dark red). Map by NOAA Climate.gov, based on data from the U.S. Drought Monitor Project.
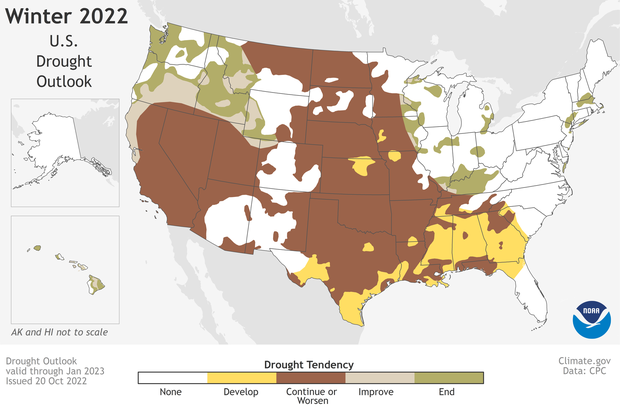
Projected changes to drought conditions across the United States through the end of January 2023. Drought is expected to continue or worsen (dark brown) across much of the central and western U.S. Map by NOAA Climate.gov, based on data from the Climate Prediction Center.
To read the full release, visit NOAA.gov.