Land - Terrestrial Climate Variables
This page describes instruments used to monitor some of the climate variables on land.
River Discharge

On the left, a staff gauge measures the height of flowing water. Photo by Chris Council, Aspen Daily News from Aspen Journalism story, New stream gauge on Castle Creek installed. On the right, an automated streamgage measures the distance to the water's surface and sends the information to a satellite. Photo by Robert Swanson.
The volume of water that flows past a point of a river per unit time is called river discharge; it is commonly expressed in cubic feet per second, or sometimes, in gallons per day. River discharge, also called flow rate, is calculated by multiplying the average velocity of the water by the cross-sectional area of the river channel. Discharge is measured by stream gauges or weirs. River discharge forecasts are based on historical flows, topography, and current conditions of soil and weather.
More information:
Links to data:
Snow Cover

Photo of SNOTEL site at Schweitzer Basin, Idaho. Credit: USDA NRCS. Diagram on right shows snow depth sensor and pillow. Credit: Colorado Avalanche Information Center.
Snow cover, as measured by satellites, describes the percentage of the ground area where snow is detected. In the Northern Hemisphere, snow cover has a significant influence on climate due to the fact that it is four to six times more reflective than bare ground. Satellites are used to measure large expanses of snow cover.
The amount of snow on the ground is also monitored at snow monitoring sites in the Western United States. These sites have precipitation gauges and "snow pillows" in areas cleared of trees. The snow pillow measures how much water is in the snowpack by weighing the snow with a pressure transducer. These SNOTEL sites provide important measurements of snow depth and water content. Water managers use these measurements to predict water supply and the potential for spring floods.
More information:
- Snow Today - Daily images of snow data and seasonal analyses for the Western United States
- Spring Snow Cover - Trend in the Northern Hemisphere
Links to data:
- SNOTEL data for Schweitzer Basin, Idaho
- Northern Hemisphere Snow Extent
- Rutgers University Snow Cover
- Snowpack: Snow Water Equivalent (SWE) and Snow Depth, by State
Glaciers
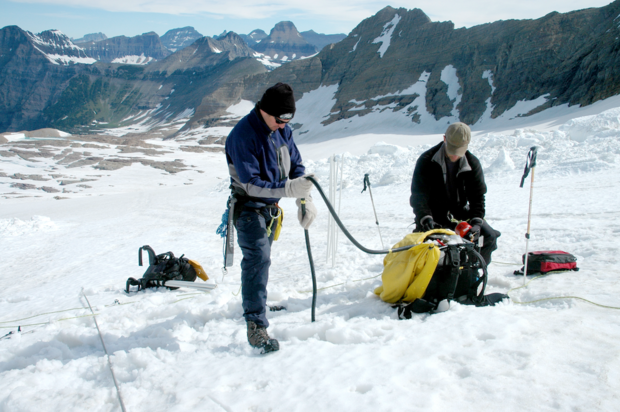
Monitoring glaciers in Glacier National Park. Photo by National Park Service.
A glacier is an accumulation of ice and snow that slowly flows downhill over land. In high mountain areas, alpine glaciers are frozen rivers of ice, flowing under their own weight into valleys. Glaciers also exist on the fringes of ice sheets. Most of the world’s glaciers are in Antarctica. Glaciers are mainly found near the poles, but glaciers exist on all the world’s continents.
For more than a century, the World Glacier Monitoring Service (WGMS) and its predecessor organizations have been collecting standardized data on glaciers around the world, using a combination of boots-on-the-ice field work and measurements from aerial and space-based instruments.
More information:
Links to data:
- Glacier Photography Collection
- World Glacier Monitoring Service Data Exploration
- Global Land Ice Measurements from Space (GLIMS) Glacier Database
Ice sheets

NASA's IceBridge campaign uses NASA’s P-3 Orion to gather detailed images of Earth’s polar areas to monitor and understand ice processes and motions. Photo by Jim Yungel, NASA.
Ice sheets are continuous masses of glacial land ice; the two ice sheets that exist on Earth cover Greenland and Antarctica.
Ice sheets are made of thousands of layers of fallen snow. The weight of overlying layers compresses snow, causing it to recrystallize into solid ice . Though they appear to be solid, ice sheets slowly spread out under their own weight, forming broad domes of ice over land.
More information:
Links to data:
Ice Shelves

This artist’s illustration of the ICESat 2 satellite shows how its six green laser beams measure the height and extent of an ice shelf. Credit: NASA.
Ice shelves form where ice sheets flow outward and extend over ocean water. They are relatively thick slabs of ice (160 to 2000 feet) that can extend ten to hundreds of miles from the coast. Imagery collected by instruments on satellites sometimes reveal long cracks in ice shelves: when large sections of ice shelves break off, they form icebergs.
More information:
Links to data sources:
- View a map of ice shelves around Antarctica's Ice Sheet
- International Ice Patrol - Iceberg sightings database
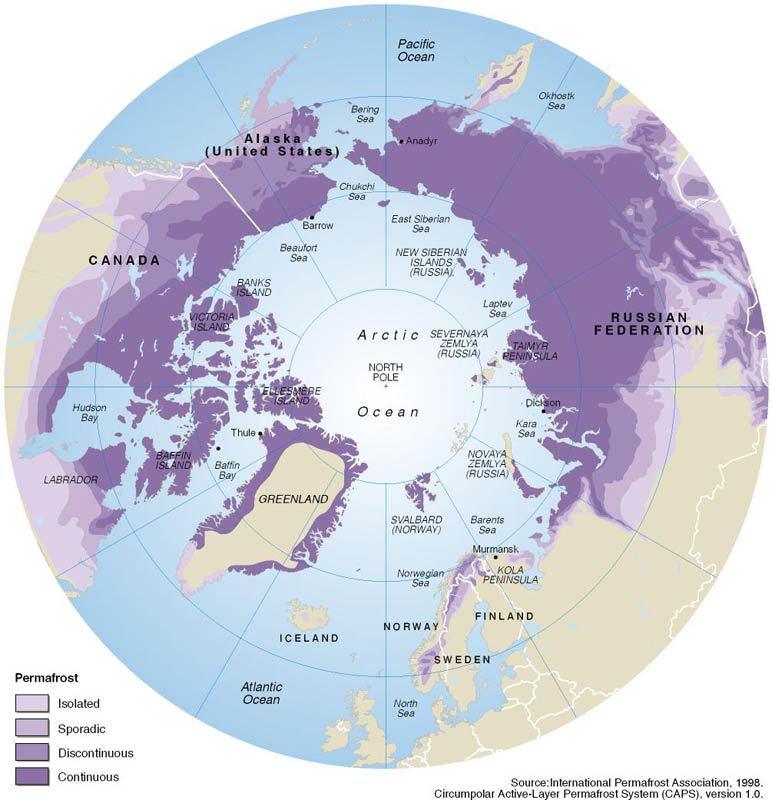
Permafrost

A person looks out on a collapsed block of ice-rich permafrost along Alaska's Arctic coast. Photo Credit: Christopher Arp, USGS.
Permafrost is soil, water, and rock that has been frozen continuously for at least two years. It exists in regions where the summer warmth is not strong enough to reach the base layer of the frozen ground. Scientists use probes and core samples, as well as instruments on satellites to monitor permafrost.
More information: Frozen Ground and Permafrost
Links to data:
Albedo
Albedo is a measure of how much solar energy a surface reflects; it is calculated as the ratio of incoming to outgoing solar energy, and is therefore a unitless quantity. An albedo value of one would be a perfect reflector, where 100 percent of the energy is reflected. Conversely, a value of zero describes a surface that absorbs all solar energy it receives. Freshly fallen snow is extremely reflective; it has an albedo of 0.95 or 95%. Forests, crops, and bare ground are not very reflective, so their albedo values are much lower. Albedo is measured by instruments on satellites.
More information:
- ClimateBits: Albedo (2-minute video)
- Interactive simulation: Earth's Albedo and the Sun's Brightness Affect Climate
- Albedo and Arctic Sea Ice
Links to data:
Land Cover

Landsat missions collect imagery of Earth’s surface. Landsat data constitute the longest existing record of Earth’s continental surface on a global basis. Credit: NASA
Land cover is defined as the physical material covering land at Earth's surface. Land cover includes both human-made and natural surfaces including soil, water, crops, roads, and buildings. By monitoring land cover over time, scientists can detect plant health and changes in vegetative cover. Scientists monitor plant health in order to forecast food supplies or the onset of drought. Land cover changes also signal changes in land use, such as the change from a farm field to a shopping mall. Satellite instruments that make images of land at various wavelengths are used to monitor land cover. Ground-based surveys are also used to calibrate the images from satellites.
More information:
Links to data:
Soil Carbon
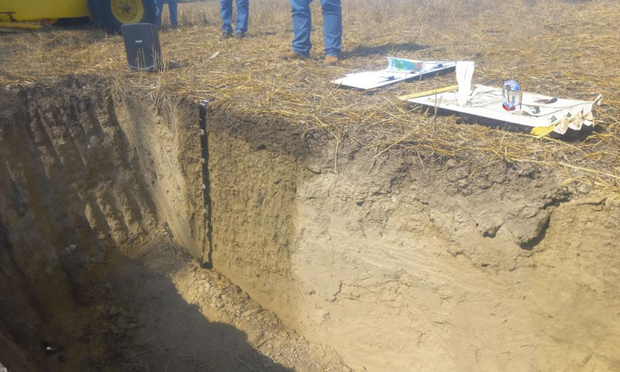
Soil Carbon Cycle and Laboratory Measurements of Carbon Related to Soil Health by Hans Klopp, Anthony Bly, and David Karki; courtesy of extension.sdstate.edu
Soil carbon is the amount of carbon held in the soil. It is a small, but vital, part of productive soil that is primarily made from decaying plant material. The amount of carbon held in the soil depends on several factors, including the type of soil and climate. Scientists measure soil carbon with automated instruments that monitor the carbon emissions from the soil. They also sample the soil and use chemical analysis to measure the amount of stored carbon.
More information:
Links to data:
Fire Disturbance

Smith River Complex fire. Credit: Bill Steven/Inciweb.
The impact of fire can dramatically alter vegetative cover and local air quality. Images from satellites and airplanes are used to monitor fire activity. When fighting fires, smaller fire-spotting aircraft are also deployed to help track fire behavior.
More information:
Links to data:
- Active Fire Data
- National Interagency Fire Center Open Data
- National Fire Situational Awareness Mapping Site
Soil Moisture

NASA's Terra satellite in orbit. Credit: NASA
Soil moisture is the amount of moisture (water) above and within the soil. Monitoring soil moisture is important for agriculture and for anticipating the potential for flooding. Soil moisture probes are relatively rare, so soil moisture is generally calculated based on recent precipitation and temperature conditions. The NASA Gravity Recovery and Climate Experiment (GRACE) satellite mission (now ended) used observations and sophisticated mathematical calculations to estimate changes in soil moisture from space. Instruments on board the Aqua and Terra satellites also measure soil moisture.
More information:
Links to data: