Greenland Ice Sheet's 2017 weigh-in suggests a small increase in ice mass
More than a mile thick in places, the Greenland Ice Sheet is so large that it would cover the Gulf of Mexico and spill over onto the shores of the Gulf Coast states. If it melts completely, it will raise the height of the ocean surface by 20 feet (6 meters). It’s already on its way: since 2002, it’s been losing an estimated 269 billion tons of ice each year. This year, however, may be an exception.
This animation shows areas of the ice sheet where surface melting—one process by which the ice sheet loses mass—was detected by satellite this summer. Melt area in 2017 was smaller than average in late spring and early summer.
#}Satellite-detected surface melting on the Greenland Ice Sheet from July 7 through September 11, 2017. The melt season started slowly, but then surged in mid-July. NOAA Climate.gov, based on data from Thomas Mote.
The animation picks up on July 7, when melt area was still relatively small and confined to the lower-altitude edges of the ice sheet. Not until July 19 does the melt area expand into the interior. From mid-July onward, the size of the melt area expands and contracts in different places in response to weather systems that pass over the island bringing sunshine and warmth or clouds and storms.
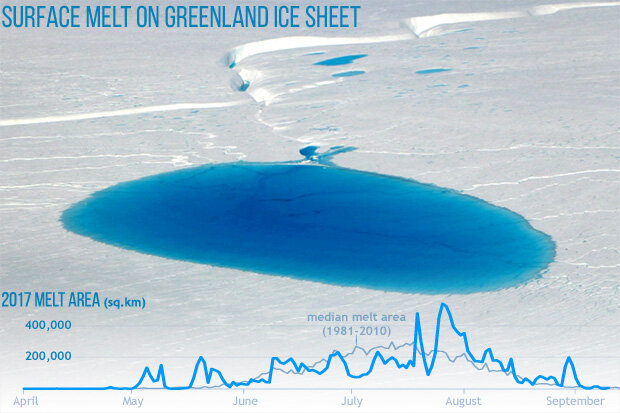
NASA aerial photo of a melt pond and stream on the surface of the Greenland Ice Sheet on July 19, 2017, with a graph of the total area with detectable surface melting this summer (blue line). From June into early July, the melt area was below the 1981-2010 median (gray line). A spike in mid-July kicked off several weeks of relatively large areas of surface melt. But melting dropped significantly again by mid-August. NOAA Climate.gov image, adapted from an original graph from the National Snow and Ice Data Center.
Each year at the end of August, climate scientists tally up how much mass the ice sheet gained in the past year through new snowfall and subtract how much it lost through surface melt and iceberg calving from the ice cap’s many glaciers. Over the past two decades, the amount of snowfall has been enough to outpace surface melting, but not ice loss from glaciers. As a result, the ice sheet has been shrinking.
According to an end of season summary from Greenland experts with the Danish Meteorological Institute, 2017 may turn out differently. According to the Institute’s preliminary estimates, about 544 billion tons more snow fell on the ice sheet between September 2016 and August 2017 than melted away. In an average year (1981-2010), net snow accumulation is closer to 368 billion tons.
The exceptionally good snow year kicked off with the remnants of Hurricane Nicole stalling out in the North Atlantic and laying down record-setting amounts of snow in eastern Greenland. A June storm blanketed parts of the ice sheet with a fresh coat of clean, bright snow, which helped reflect the summer sun and delay the onset of significant surface melting. The finishing touch was a rare mid-August snow storm that brought the ice loss season to an early close.
One hundred seventy-six billion tons of extra snow would be great news if that were the whole story of the ice sheet’s health. But as the Institute explains in an article on their Polar Portal Website, Greenland also loses nearly 500 billion tons of ice each year on average through its glaciers, either by icebergs calving into the ocean or through submarine melting of the glaciers where they reach the ocean. They continue…
If we subtract this from our figure of 544 Gt [Gt=gigatons, or 1 billion tons]…it would suggest Greenland gained a small amount of ice this year. However, compared to the approximately 3600 Gt of ice…that Greenland has lost since 2002 this year’s slightly positive balance does not add much extra.
Said another way, if the Greenland Ice Sheet could put on 44 billions tons of ice each year going forward, it would take 82 years to get back to its 2002 self.
References
National Snow and Ice Data Center quick facts on ice sheets
The Arctic Report Card 2016: Greenland Ice Sheet
End of the season summary of surface mass balance on Greenland Ice Sheet
