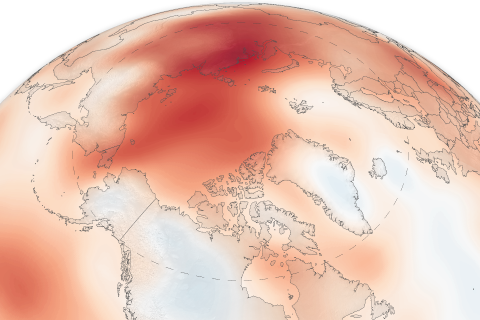
The 15th installment of NOAA's Arctic Report Card NOAA's 15th Arctic Report Card catalogs the numerous ways that climate change continues to disrupt the polar region.

The 15th installment of NOAA's Arctic Report Card NOAA's 15th Arctic Report Card catalogs the numerous ways that climate change continues to disrupt the polar region.
Unusual weather conditions in 2017—including a blizzard caused by the remnants of 2016's Hurricane Nicole and a short surface melt season—are behind preliminary estimates of a small gain in ice mass on the Greenland Ice Sheet this year.
September 8, 2017
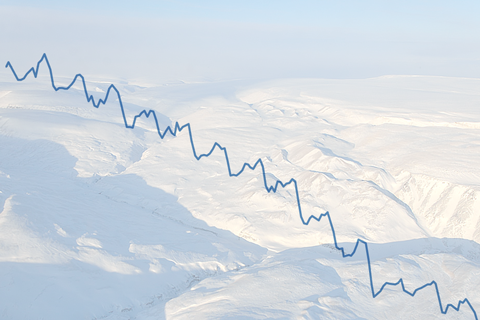
Although surface melt did not set a new record in 2016, the Greenland Ice Sheet did continue a long-term trend of decreasing mass, according to the latest Arctic Report Card from NOAA and its partners.
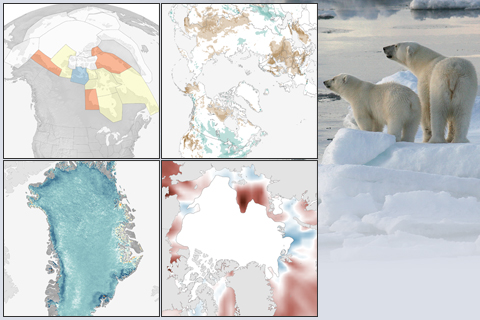
The latest installment of NOAA's Arctic Report Card confirms that Arctic air temperatures are rising at more than twice the rate of the planet as a whole. This collection of images highlights some of the key changes in physical and biological conditions in the Far North.
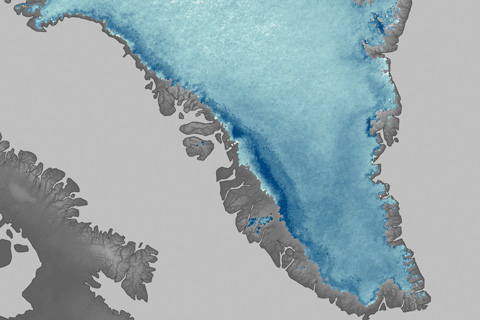
Melt ponds, snow loss, and other warming-induced changes are making the surface of the Greenland Ice Sheet far less reflective in the summer than it was even a decade ago. The darker ice surface absorbs more sunlight than it once did, accelerating warming and melting.
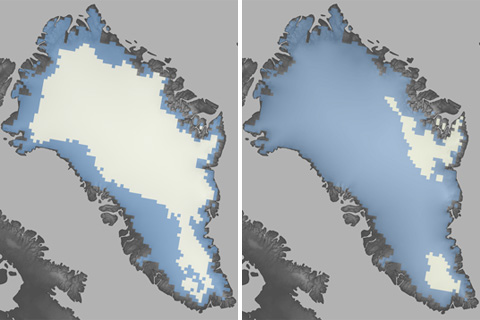
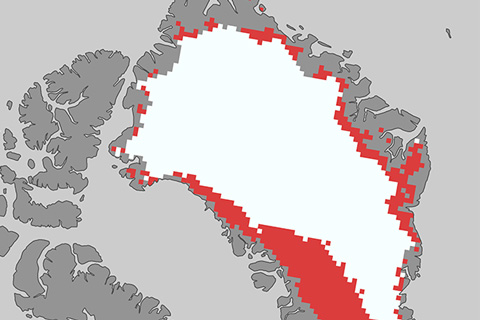
The summer of 2012 brought Greenland far more extensive melt than anything observed in the satellite record: in July 2012, surface melt extended over nearly the entire ice sheet. The standardized melt index was nearly double the previous record.
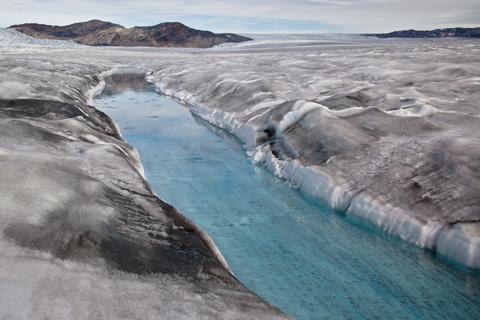
In the 2011 Arctic Report Card, scientists report that the bright white surface of the Greenland Ice Sheet has grown less reflective. The darker surface absorbs more sunlight, accelerating melting.
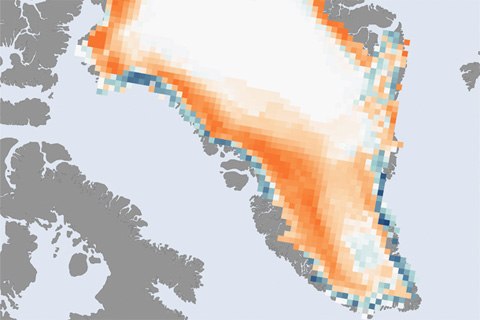
The surface melt season on Greenland lasted up to 30 days longer than average in 2011, and it affected 31 percent of the ice sheet surface. Ice mass loss from Greenland in 2011 was about 430 gigatons—enough ice to raise global sea level by just over 1 millimeter.
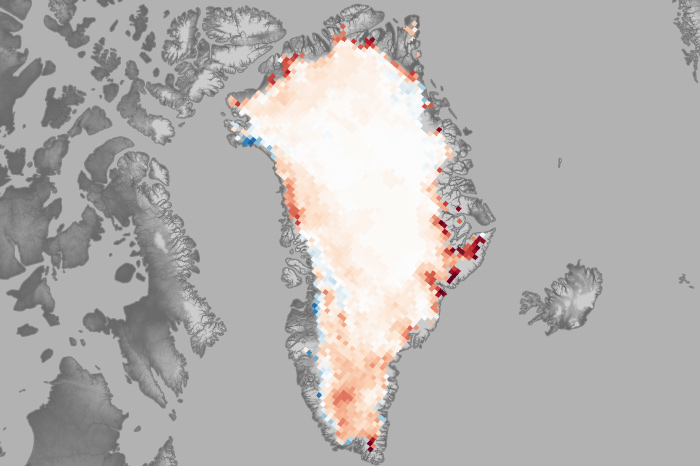
Greenland has lost ice mass every year since 1998. Losses in 2021 would have added about 0.2 millimeters to global sea level.