NOAA climate experts are working on the latest update to the U.S. Climate Normals. Here’s a sneak peak at how what’s normal for winter will change.
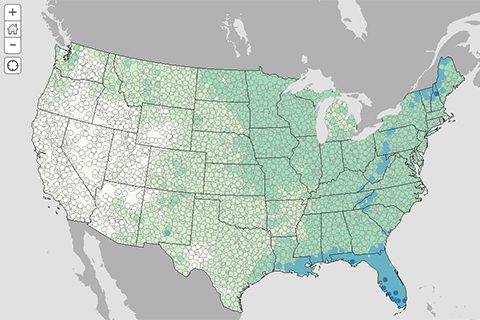
If you had to pick your Fourth of July picnic location based solely on past weather, where does the climate record say you'll have the least chance of rain? Our interactive map shows historic odds of rain on your parade.
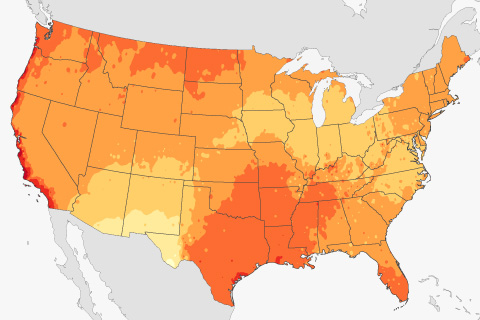
Based on observations from 1991-2020, much of the United States has its hottest day of the year by the end of July. Historically speaking, where is the warmest day likely still to come?
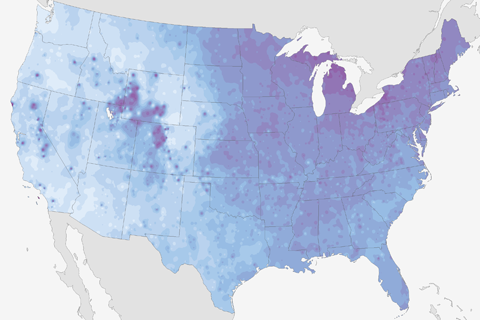
For some states, the coldest day of the year usually occurs near the start of winter, while for others it comes near the end. This map reveals when history says your state will have its coldest day of the year.

For those of you dreaming of a white Christmas, NOAA has a map showing the historic probability of your dream coming true.
When does the chance of an overnight freeze drop below 50 percent? Explore this map to find out.
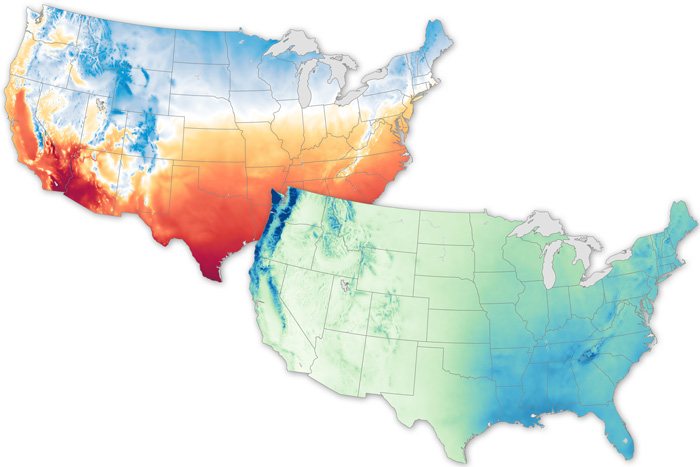
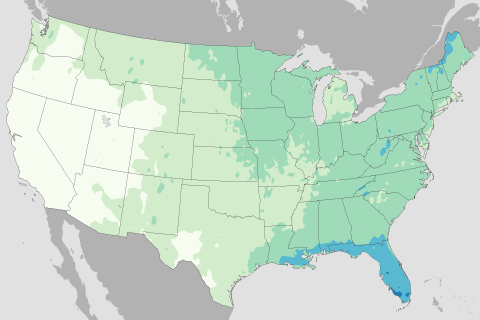
Maps showcase the broad range of climates across the contiguous United States.
In this Beyond the Data blog, Deke Arndt talks about using the climate record to predict the odds of rain on the Fourth of July.