February 2024 ENSO Outlook: All along the La Niña WATCH-tower
On a brisk early February morning, all of us El Niño-Southern Oscillation (ENSO) forecasters emerged from our burrows and saw our shadows. That can mean only one thing: conditions are favorable for the development of La Niña within the next six months. Yes, the February ENSO Outlook officially announces that we are in a La Niña Watch, even while, at the current moment, the Pacific Ocean remains in an El Niño (this is simultaneous to the ongoing El Niño Advisory—here is an explainer to help sort it out). The outlook gives a 79% chance that El Niño will transition to ENSO-Neutral by the April–June period, and then a 55% chance the Pacific transitions into La Niña in June–August. Confused? I’ll explain it all without the help of any prognosticating rodents (take THAT, Punxsutawney Phil).
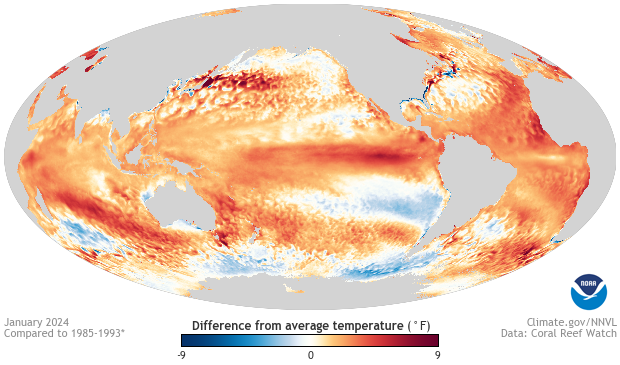
January 2024 sea surface temperature difference from the 1985-1993 average (details from Coral Reef Watch). Much of the global oceans are warmer than average. NOAA Climate.gov image from Data Snapshots.
El Niño’s current status
Let’s start with the here and now. At the current moment, El Niño remains across the equatorial Pacific Ocean. In January, sea surface temperatures remained above average across most of the Pacific, though temperatures fell a bit across the eastern and central Pacific. Monthly values in the Niño-3.4 region (the key tropical Pacific monitoring region for ENSO and the basis for the Oceanic Niño Index (see below) dropped from just over 2°C above average in December 2023 to 1.87°C above average in January 2024. Overall, the most recent Oceanic Niño Index (ONI) value—how NOAA classifies the strength of events—for November–January places this event’s peak strength at ~2°C, or the fifth highest on records back to 1950 (**).
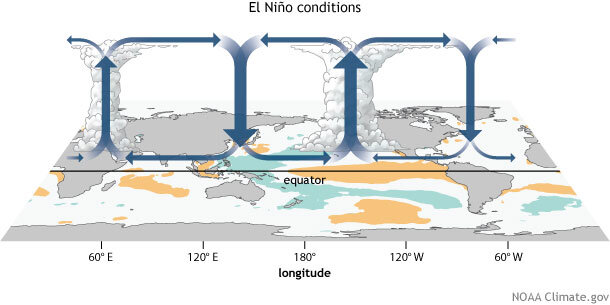
Generalized Walker Circulation (December-February) anomaly during El Niño events, overlaid on map of average sea surface temperature anomalies. Anomalous ocean warming in the central and eastern Pacific (orange) help to shift a rising branch of the Walker Circulation to east of 180°, while sinking branches shift to over the Maritime continent and northern South America. NOAA Climate.gov drawing by Fiona Martin.
Atmospherically, El Niño weakened a bit as well over the last month. Remember, El Niño is an ocean-atmospheric phenomenon. During El Niño, the atmosphere over the tropics—the Walker Circulation—gets all jumbled up. The result in the Pacific is weakened trade winds, an increase in thunderstorm activity near the Dateline, and a reduction in thunderstorms across the Western Pacific (also, usually, across the Amazon). However, in January, the trade winds were closer to average across the equatorial Pacific, and while thunderstorm activity remained a bit elevated near the Dateline, it was instead closer to average across Indonesia in the western Pacific.
Put together, it looks clear that this El Niño event is past its peak. However, it’s important to remember that El Niño’s impacts on global temperature and precipitation can linger through April.
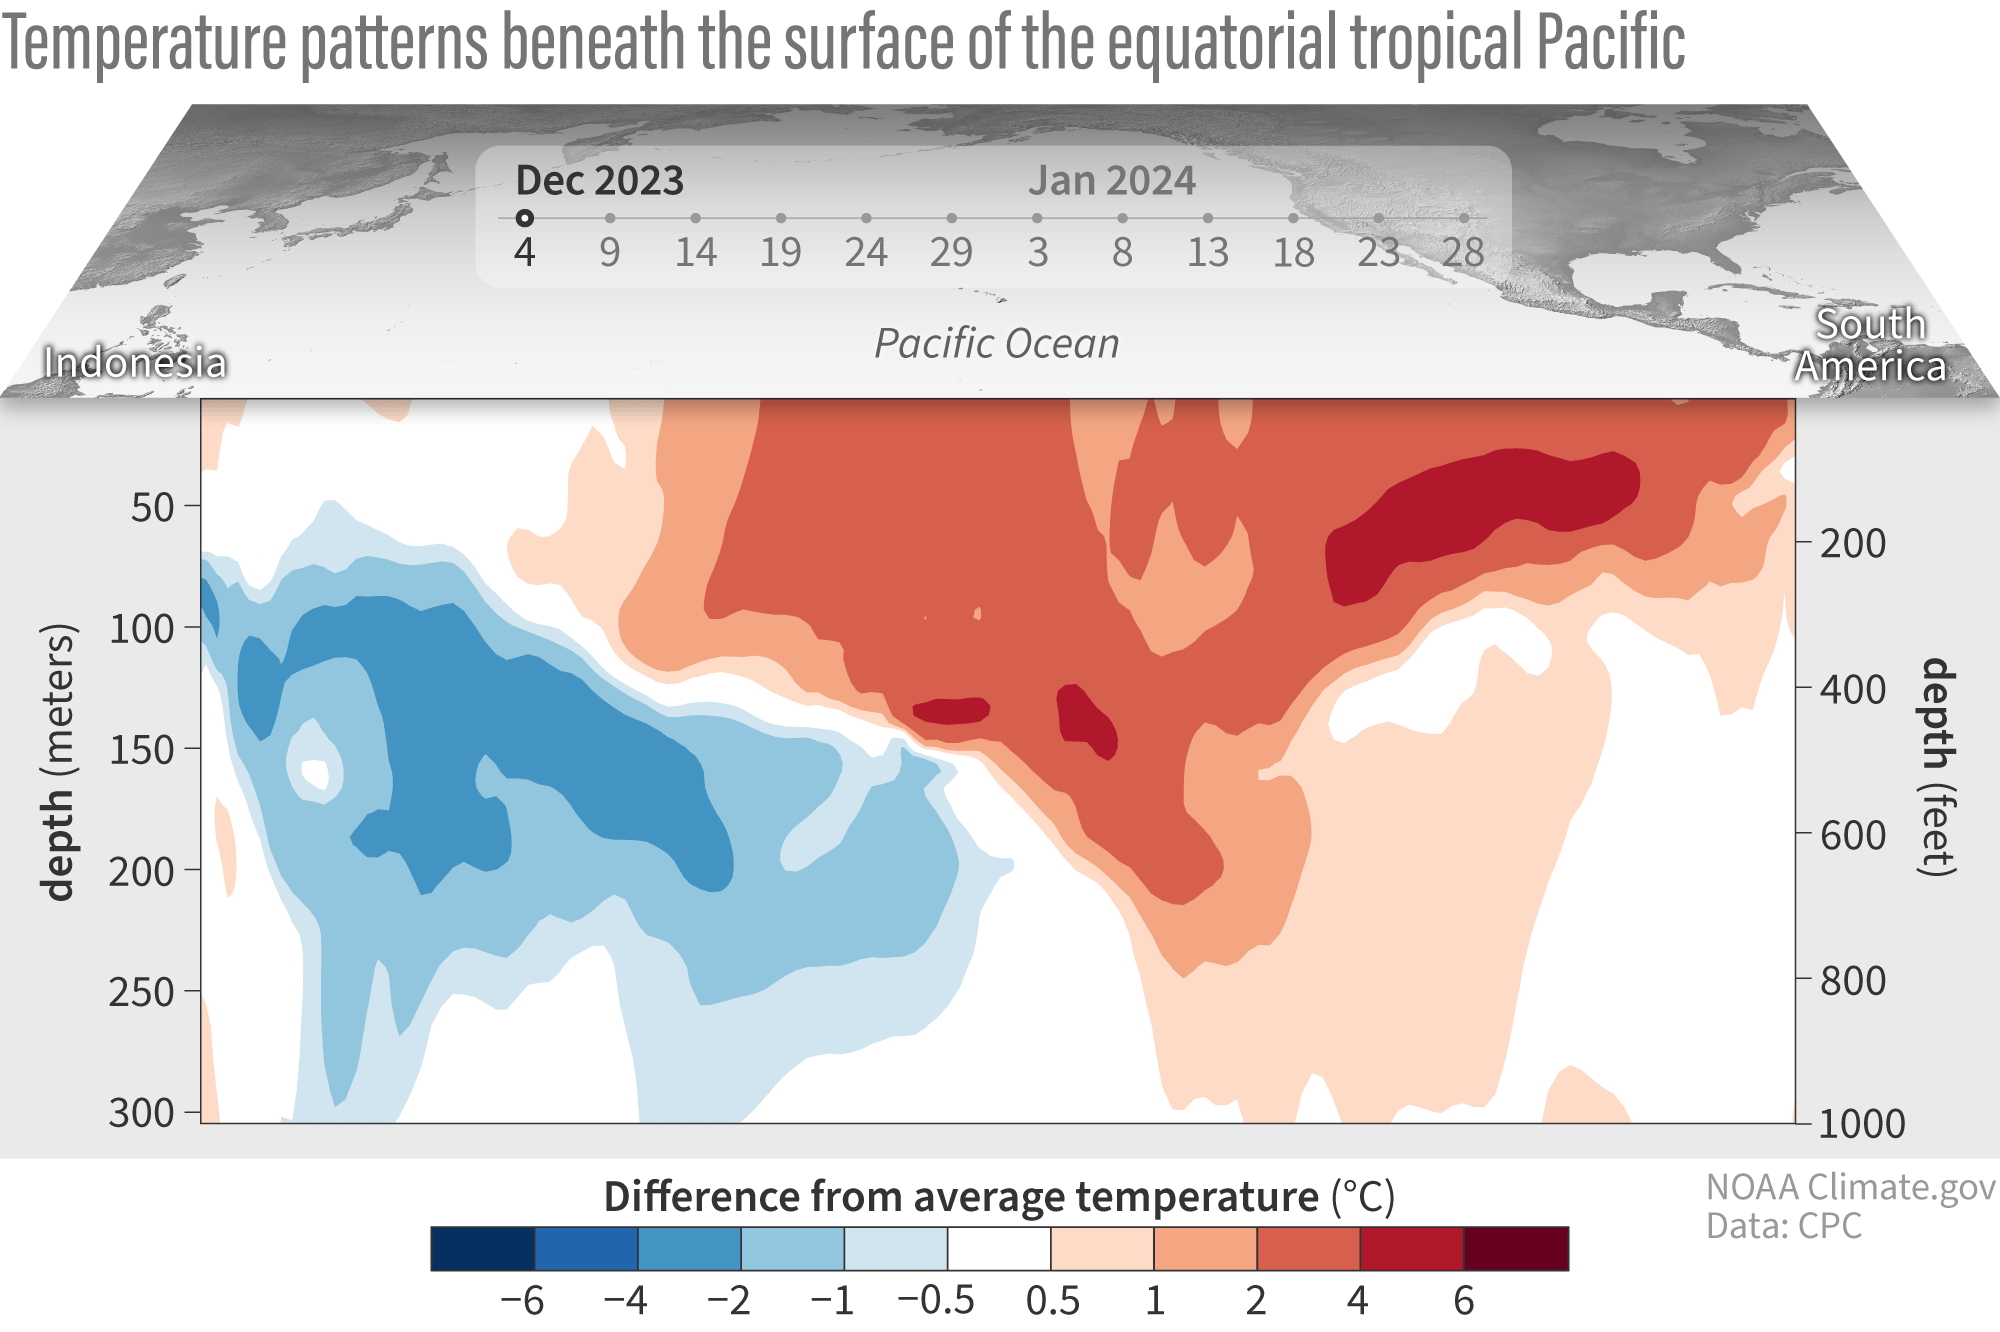
Water temperatures in the top 300 meters (1,000 feet) of the tropical Pacific Ocean compared to the 1991–2020 average in December 2023–January 2024. NOAA Climate.gov animation, based on data from NOAA's Climate Prediction Center.
Is that all?
While everything I said above is all fine for the surface, the BIG story is happening underneath the sea surface in the Pacific. Averaged across the entire equatorial Pacific Ocean, ocean temperatures in the upper 300 meters returned to near-average for the first time in almost a year. And it’s clear that cooler-than-average ocean waters are widespread at depth and expanding eastward, even while above-average temperatures persist closer to the surface in the central/eastern Pacific.
Where is this all going?
That’s the million-dollar question. The seasonal prediction models that forecasters look to for guidance are pretty confident in a transition from El Niño to ENSO-neutral sometime during the northern hemisphere spring 2024. Following that, there is a general consensus among the models that La Niña will follow during the summer. Now when it comes to transitions, there is always a bit of uncertainty on the exact timing, as an El Niño can end in a hurry. After all, the current outlook has only a two-season difference between the end of El Niño (79% chance in April-June), and the start of La Niña (55% chance in June-August). And some of the influencers of that transition can be atmospheric patterns that are not forecastable this early on, like the Madden-Julian Oscillation or random weather events.
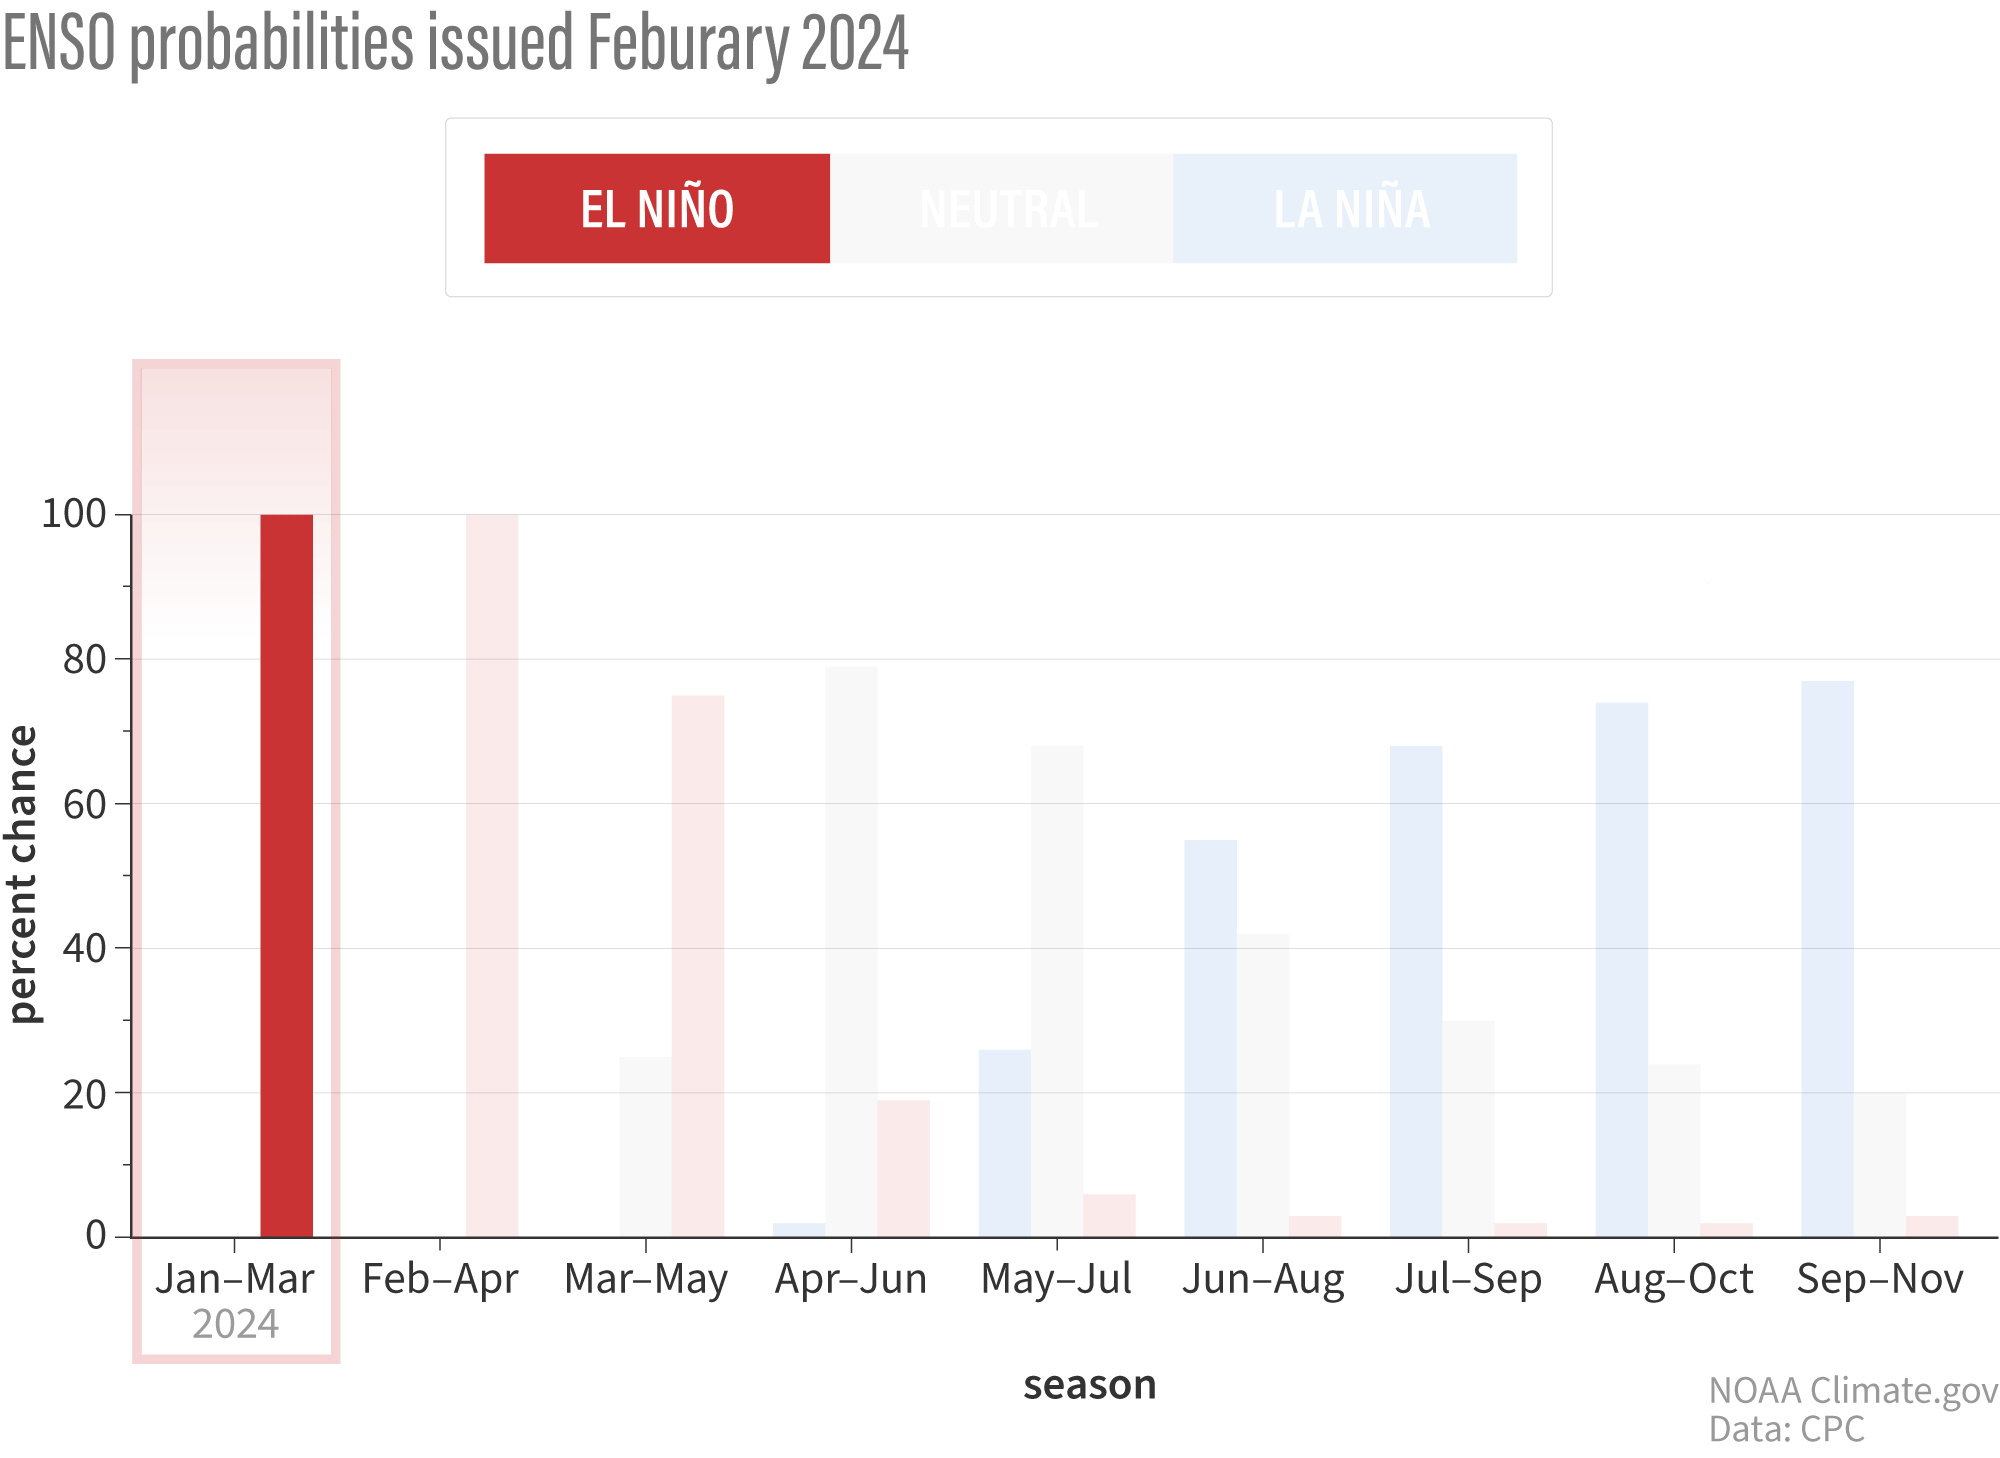
Animation of the NOAA Climate Prediction Center February 2024 ENSO forecast for each of the three possible ENSO categories for the next 8 overlapping 3-month seasons. Blue bars show the chances of La Niña, gray bars the chances for neutral, and red bars the chances for El Niño. Climate.gov animation based on graph by Michelle L'Heureux.
How common are transitions from El Niño to La Niña?
Going back to 1950, over half of the El Niño events were followed shortly thereafter by a transition to La Niña (after a brief period of time in ENSO-Neutral). So, it would not be at all uncommon to see this sort of potential outcome this year.
Breaking that down even more by looking at similar strong El Niños, five of the eight events since 1950 were followed by a La Niña. And that transition happened rapidly. Two years (1973 and 1998) had only one 3-month period of ENSO-Neutral conditions before switching to La Niña. Two years (1983, 2010) had two 3-month periods of ENSO-Neutral in between. And 2015 had three 3-month periods.
Suffice to say, the historical record suggests that if the equatorial Pacific moves from a strong El Niño into a La Niña, it doesn’t seem to waste its time.
We’ll keep our eyes on the Pacific for you to help narrow down when and how this El Niño will end. So check back with us next month!
Signed,
The most accurate mammalian weather/climate forecasters
** A pesky annoyance is the fact the 1965-66 El Niño also peaked at 2.0°C, but it did so only during the September-November and October-December seasons. By November 1965-January 1966, it was 1.7°C. So, if we rank just by November-January seasons, then the current 2023-24 event is ranked fifth. But if we rank by all near-winter seasons, then this event is basically tied for fifth.
Comments
Spring Predictability
So from years of "spring predictability barrier" to just, BLAM!! Here's what will be(I know.... percentages...) into spring and well past it. Have you folks cracked the code? Does it really just come down to the deeper water?
I'll grab this one since I'm…
I'll grab this one since I'm, undoubtedly, the Lead Chief Whiner of the spring predictability barrier. It's a great question! Why are we doing this in February? What makes this situation different? The key nuance here is we are coming off a quite strong El Nino event. Historically, a strong El Nino event is followed by La Nina about 60% of the time. But it's not just that fact alone, there is also strong model consensus (all types of models from the fancier supercomputer models to the simple empirical ones) that are leaning in this direction. That level of consensus is somewhat unusual. Finally, as you point out, we are seeing the seeds for destruction under the surface (mechanism here). With all that said, a peak chance of ~75% in the fall means there is still a 1 in 4 chance this La Nina doesn't happen at all. So let's see how this coin flips...
Questions
From reading this post, it appears that the forecast for La Nina to develop later this year is based on how surface temperatures in the equatorial Pacific are starting to cool, how there is a large and growing pool of cooler-than-normal water below the surface in the equatorial Pacific, and how a bit more than half of strong El Ninos since 1950 have been followed within a few months by La Nina (which Michelle L'Heureux also cited in her response to Bailey's response), even though conditions in the Pacific during the spring make it hard to predict what phase ENSO will be in later in the year.
Is all of this correct? As well, what other factors are at play that strengthen this conclusion? And, what factors are at play that weaken confidence in this prediction?
forecast confidence
I think you hit on the big factors giving higher-than-normal confidence in the forecast despite not passing through the "spring predictability barrier." One other important factor is that we have strong agreement in our dynamical forecast models, and they have a history of doing pretty well when they are initialized with a big El Nino.
However, even though the dynamical models have strong agreement, they still have some ensemble members that do not transition to La Nina. This hints at the role that chaotic weather ("stochastic wind forcing") might play in terms of the timing of the transition to ENSO-neutral and whether or not we have La Nina next fall. For example, the processes that set the wheels in motion for El Nino or La Nina often involve sequences of strong wind events along the equator, and those events are not predictable more than a few weeks in advance (sometimes they're tied to the Madden-Julian Oscillation). So, until those wheels are fully set in motion for this La Nina, there will at least be some uncertainty.
I will also add that there can be influences from other ocean basins (Indian and Atlantic) on the evolution of ENSO, and it's not always clear to me how that may play out. So, that may also be an existing source of uncertainty.
Still, the odds of La Nina next fall are quite high considering how far out we are.
A Mexican farmer's lament
In my part of Mexico, the central highlands, we are suffering extreme and prolonged drought. It seems that both La Niña and El Niño are bad for us. We seem to do better during Neutral periods, so this news that we will only have a short Neutral is seriously depressing. Last year, the drought along with the heat dome, was very devastating in our region. I would love to have some hope this year will be better but I don't see any. Though I realize many other factors play in to whether we get rain or not. I wish we could have a clue as what the weather might be ...
Mexico drought
I'm sorry to hear about your plight, and it's unfortunate that at least the northern two-thirds of Mexico has been very dry this winter despite El Nino typically bringing wetter conditions to this region. I hope you get drought relief soon despite the odds favoring La Nina later in the year.
A list of El Nino years that had the most impacts
Thanks Tom. Great article and graphics. Here's a list of El Nino years with the greatest impacts on the US.
1969 - 70
1976 - 77
1977 - 78
2014 - 15
The above El Nino years were all weak, which is interesting. The winters were all cold and snowy here in the Ohio valley. I looked up the PDO on these years and they were all in the positive phase the year they formed. This year's strong El Nino started in the negative phase of the PDO and still is after passing it's peak. It had very little impact on our winter here in the Ohio valley with the cold and snow. I find this interesting too. Your thoughts please.
Thank You,
Stephen S.
El Nino impacts
Thanks for your comment. I cannot speak for Tom, but I can offer some thoughts. You raise an interesting question, but I think it's a tough one to answer. The first question is how to measure "greatest impacts" on the US. Would it be the strongest seasonal anomalies? Or the strongest seasonal anomalies that agree with the pattern of average El Nino impacts? How do we weight the different meteorological variables and regions?
If we can get past those challenges and agree on an appropriate measure (albeit with some subjectivity), we then would have the challenge of determining why those El Ninos had the greatest impact. The simplest expectation is that the strongest impacts would come from the strongest El Ninos (with some support for that expectation from my November blog post). But if that isn't the case, as your comment suggests, then the question would be why. Could it be that the particular "flavor" of El Nino (i.e., the details of the tropical sea surface temperature pattern) resulted in stronger impacts? Or could it be that chaotic weather noise happened to constructively interfere with the El Nino signal? Or, as you suggest, could it be that the impacts of some other low-frequency mode like the PDO constructively interfered with the El Nino impacts? The answers to those questions have big implications for the seasonal prediction of the impacts. It's basically impossible to tease out those answers from observations alone, so we would have to rely on climate models, particularly those that focus on the response to the observed sea surface temperature patterns (so-called "AMIP experiments"). I haven't examined this problem directly, but I suspect that it would be difficult to rule out that El Nino amplitude is the biggest factor for expected impacts, and that constructive or destructive interference by chaotic weather noise is the biggest modulator of the impacts that actually occur. That doesn't mean that El Nino flavors or interference by other modes cannot be a factor as well.
Snow in Florida
We had snow here in Central Florida in January of 1977. Definitely was a surprising impart to say the least!!
RE: Snow in Florida
Interesting! Later today, we are going to be publishing a post in our other blog about the stratospheric polar vortex and what typically happens down at the surface when the vortex breaks down. (Spoiler alert: the eastern US tends to be a bit colder than average). As part of preparing for that post, our experts sent us a list of every polar vortex breakdown on record since 1958. I just checked, and indeed, there was a polar vortex breakdown in January 1977!
Shorter and more variability
In paraguay (south america) we experienced in the parana river basin extreme rain in november and december, after a 4 year in a row la niña impact. On the other hand, mato gross and the paraguay river basin experienced severe drought during that time.
Right now we jumped from typical el niño conditions to la niña again with both rivers with below average river flows.
Events are getting shorter and more variablity is coming into the picture.
Does a single 2.0 ONI make it a "very strong" El Niño?
It looks like only NDJ ONI will be at the 2.0 level and then from the monthly values it will begin to drop for DJF. Does that single spike bump the historical categorization up a level?
"very strong"
The threshold for categorizing El Nino as "very strong" is subjective and unofficial, so there is no set rule. The bottom line is that however you categorize it, this El Nino will be among the top 5 since 1950, so it's stronger than most.
El nino teve impactos muito localizados ou anulados.
Muito se falou sobre o el nino em meados de 2023 que traria impactos severos em muitas partes do planeta.
Então quando se formou e começou a atuar trouxe impactos bem leves sobre o clima a partir de agosto, aqui na parte sul do Brasil onde normalmente chove muito e de forme abundante em anos com enso positivo. Desde a primavera persistiu a irregularidade, teve somente um episódio de chuva extrema no mes de outubro onde altos volumes foram registrados em um curto espaço de tempo, chuvas fortes sao comuns no sul durante a primavera. Ademais tivemos fortes momentos de estiagem o que incomum durante um el nino e frio tardio ate em janeiro teve uma onda de frio. Outros el ninos foram muito normais como o de 2016 que causou chuvas frequentes por um longo período. A atmosfera esta anormal, pois os ventos nos níveis mais altos da atmosfera permanecem sentido sul para norte, deveria ser o oposto de oeste pra leste. A grande questão que fica e o que anulou os efeitos do ele nino clássico e ainda gerou uma grande quebra de safra no Brasil de sul a norte(....) Sera os efeitos do aquecimento global? Ou ainda as correntes oceânicas estão perdendo força ou mudando de direção? Também um derretimento anormal das geleiras da Antártida o que levou muita água gelada pro oceano? Enfim muitas duvidas poucas respostas!
Thanks for this info... I…
Thanks for this info... I used google translate, so hopefully I got the main points. Anyway, I see that it was wetter than average in southern Brazil during November 2024. During December that wet signal shifted a touch to the south so it impacted northeastern Argentina and Uruguay (also regions with an El Nino wet signal). During January, that wetter signal vanished and it was drier. So, at this point, it's hard to assess that the seasonal mean (3-month average) signal has demonstrably 'failed' as 2 of those 3 months were ballpark consistent with the El Nino signal. Worth exploring some more. I should add that the expected El Nino wetter signal in that region is only from September-January, so I might not expect those classic El Nino signals to persist for much longer.
La Niña Watch
hi, mention of a La Niña now seem premature in that the variation in 3-month running means before the return of La Niña (not return to Neutral) ranges (from the ONI chart) from 1 or 2 3-MRMs to about 50 3-MRMs. It's now expected that there will be a La Niña some months in the future, as we know spring will follow winter. i just think it is premature to expect people to get ready for a La Niña projection now. Just a thought. Mickey
Hi -- as I see it, it is…
Hi -- as I see it, it is really up to the user to decide the decision thresholds for them since its specific to whatever their interest is (and their interests are all over the place). Some people may not be able to do anything with these odds and others may want to. That's up to them! We provide the probabilities for the ENSO event itself for nine upcoming overlapping seasons. Aa Watch is declared if conditions are favorable within the next 6 months and since JJA was 55% we triggered the Watch. At the longest lead (Sept-Nov), there is still a 1 in 4 chance it will not pan out, so folks should plan accordingly given the certainty specified. Folks can certainly debate which thresholds we should be using, but at least given the *written* policy guidance, this is why we issued one.
El Nino Impacts in Malaysia
Hi all. After reading the blogs since the announcement of El Nino which also coincided with one of the strongest positive Indian Ocean Dipole in June last year, I am anticipating for drier and warmer than normal weather conditions to occur as these are the typical impacts of co-occurrence of El Nino and positive Indian Ocean Dipole towards Malaysia or Maritime Continent as a whole. However, when I read the sub-seasonal monthly weather reviews since June 2023 until January 2024 issued by the ASEAN Specialised Meteorological Centre (ASMC), I noticed that the rainfall anomalies in Malaysia is either near or above average throughout this period (only September and October showed below average rainfall anomalies for most part of the country) and in fact, Malaysia even experienced prolonged heavy rainfall that leads to big floods in November and December 2023. I also noticed that it rained a bit more frequent where I live (near Kuala Lumpur, west coast of Peninsular Malaysia), the same way it rained during the triple dip La Nina we had recently but it was hot even though it rained frequently. So my question is does these two climate variability phenomenon give minimal impacts to Malaysia in terms of rainfall distribution when they are at a strong level or does this caused by the unprecedented warming of SST around the globe including in the Malaysian waters?
Thank you.
Amirul Hakimi,
a young Malaysian meteorologist in the making.
La Niña
What impact will La Niña have on the northeastern US next winter?
Tail risk seems high
That's an amazing forecast, as usual! To put more context, I work in the financial markets and some instruments enable to hedge some weather catastrophe risk via insurance - some of these forward valuations take into account forecasts such as the ENSO one.
It's the first time I can remember that there is such a strong consensus on a transition period (with quite high odds we will end up with La Niña by September). It looks like the tail risk is heavily weighed up on El Niño or the neutral period being longer than expected. Not posing the results into question, i.e., La Niña is the most likely event, but the current forecasts make hedging against an El Niño scenario very cheap.
Chinese weather control
Chinese weather control is a major factor in this. China was throwing table salt into the atmosphere to raise rainfall and that has reversed which will cause temperature to utterly collapse.
Weather modification not behind ENSO transitions
I have no idea whether China or any other country has a robust weather modification program, but I am 99.9999% sure that weather modification is not behind the projected emergence of La Niña later this year. There's simply no evidence of any sort of weather modification on the massive scale that would be necessary to influence the ENSO phenomenon. I mean, we can't even be sure whether volcanic eruptions—which "seed" the atmosphere with cloud condensation nuclei in amounts far larger than any manmade cloud-seeding experiment I can imagine being carried out surreptitiously—can influence ENSO. (https://www.climate.gov/news-features/blogs/enso/can-volcanic-eruptions…) If weather mod efforts had any hope of affecting ENSO, they would have to be so large in scale that there would be absolutely no way to hide them.
Potential impact of receding El Nino and emerging la nina
For the Indian population, this news will be read with lots of interest. We have typically seen that El nino years bring higher temperatures, and significantly less amounts of rainfall during the monsoon months (June to September). And it is the reverse situation in La Nina years. Of course there are other variables like impacts of IOD etc. Past couple of years we have suffered a lot due to less rainfall and we all hope that La nina conditions can help us with better monsoons ! Any insights / perspectives around this will be much appreciated !
I'll refer you to an oldie…
I'll refer you to an oldie-but-goodie post by Tom: "ENSO and the Indian Monsoon... not as straightforward as you'd think." The title speaks for itself!
All Along…
Love the title. There must some kinda way outta here!
Thanks for so much info!
Add new comment