March 2024 ENSO update: award season
El Niño—the warm phase of ENSO, which is short for El Niño-Southern Oscillation—is still hanging on in the tropical Pacific, but signs are pointing to a quick transition to neutral conditions by the April–June period. There’s a 62% chance of La Niña getting the golden ticket by June–August. Stay tuned, because La Niña affects global climate patterns, including the Atlantic hurricane season and North American winter.
Red carpet
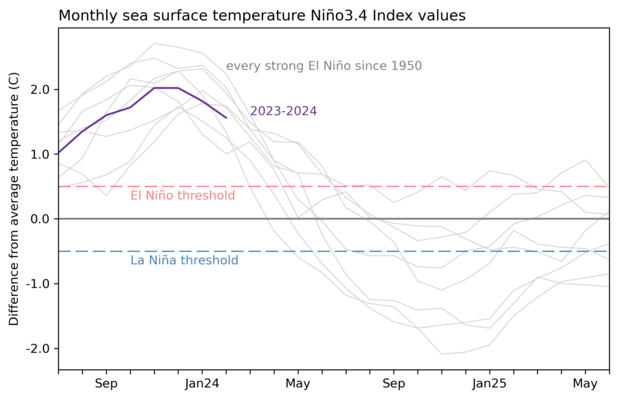
The sea surface temperature in the Niño-3.4 region of the tropical Pacific (our primary ENSO-monitoring region) was 1.6 °C (2.9 °F) above the long-term average (long-term = 1991–2020) in February, according to our most reliable dataset, ERSSTv5. This is still comfortably above the El Niño threshold (0.5 °C above the long-term average), although clearly off the peak from late last year.
For your consideration
We monitor the temperature of the water under the surface of the Pacific, roughly the top 300 meters (~1000 feet), for signs of what’s to come. This subsurface water has been warmer than average for the past year, feeding El Niño’s warm surface water. However, the subsurface warmth peaked in November, and has been gradually waning over the past few months, becoming cooler-than-average in February. An upwelling Kelvin wave—a blob of cooler-than-average water that sloshes from the west to the east under the surface—developed in January, strengthening and rising toward the surface through February. In fact, a small region of cooler-than-average surface water developed over the past week or so, which you can see in the NOAAView Data Exploration Tool.
This change in the subsurface adds to our confidence that El Niño will continue weakening. Most of our computer climate models predict that neutral conditions will develop by April–June, and forecasters estimate an 83% chance of this.
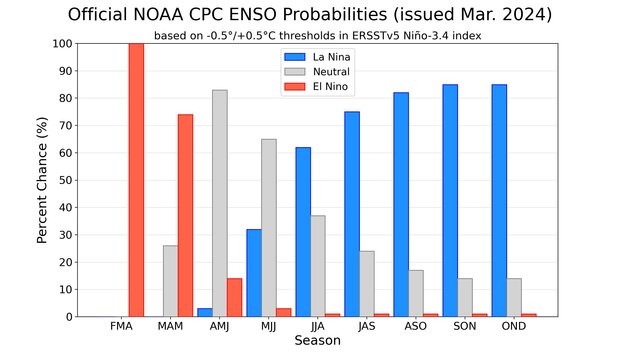
NOAA Climate Prediction Center forecast for each of the three possible ENSO categories for the next 8 overlapping 3-month seasons. Blue bars show the chances of La Niña, gray bars the chances for neutral, and red bars the chances for El Niño. Graph by Michelle L'Heureux.
There’s a 62% chance that La Niña will arrive by June–August, but there’s also about a 1-in-3 chance it will develop even earlier, by May–July. La Niña following close on the heels of a strong El Niño is fairly common, occurring after 5 of the 8 strong El Niño events in our historical record (starting in 1950—Tom has more details about the numbers in his post last month.)
One theory about why this El Niño-La Niña handoff occurs is called the “recharge-discharge oscillator.” Heat builds up in the tropical Pacific during El Niño, raising the local sea level in the central and eastern equatorial Pacific. This gets uncomfortable for Nature, and to get back to normal conditions, ocean currents move the heat away from the equator, and cooler water from deeper levels rises up—sometimes, enough cool water to swing into La Niña. There’s a lot more to this mechanism than I’ve covered here, so for more details check out Michelle’s excellent post “the life and death of El Niño.”
Broadcast
While ENSO calls the tropical Pacific home, its reach is global. In the likely event that La Niña develops, it will affect global temperature and rain/snow patterns just as El Niño did this past winter (more on that in a minute!). These impacts are never guaranteed, but ENSO tilts the odds toward specific patterns, giving us an early picture of potential upcoming conditions.
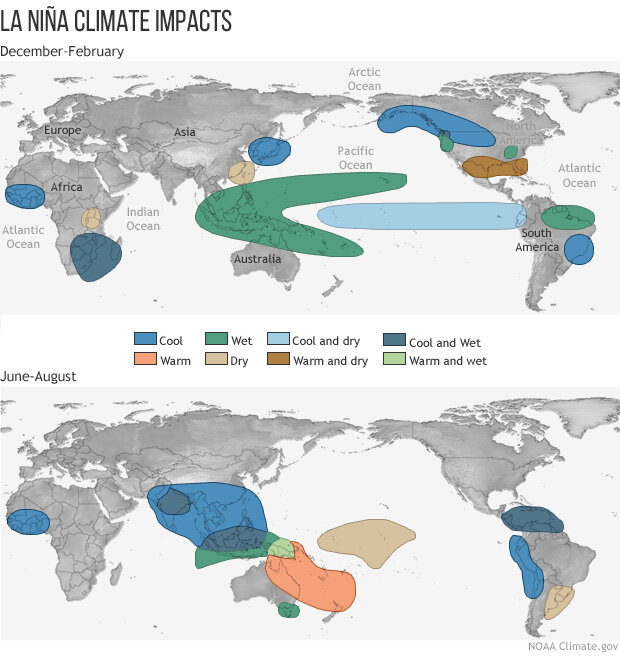
Temperature and precipitation patterns that are typical of La Niña during (top) Northern Hemisphere winters and (bottom) summers. Map by NOAA Climate.gov, based on originals from the Climate Prediction Center. Larger images and maps for El Niño are available in this post.
La Niña can also be a supporting character in the Atlantic hurricane season. In a nutshell, La Niña tends to reduce wind shear—the change in wind between the surface and high up the atmosphere. Less wind shear can make it easier for hurricanes to strengthen. NOAA’s hurricane outlook comes out in May, so we’ll know more then about how La Niña, ocean temperatures, and other factors are likely to affect hurricane activity this season.
In memoriam
Nat will delve into how U.S. precipitation played out this past winter in his post later this month, so I’ll just briefly touch on one very notable feature of this winter’s temperature pattern here—the warmest winter on record for the Great Lakes and Upper Midwest, causing historically low ice levels in the Great Lakes. El Niño influences winter temperature, so can we blame this on El Niño? Not so fast!
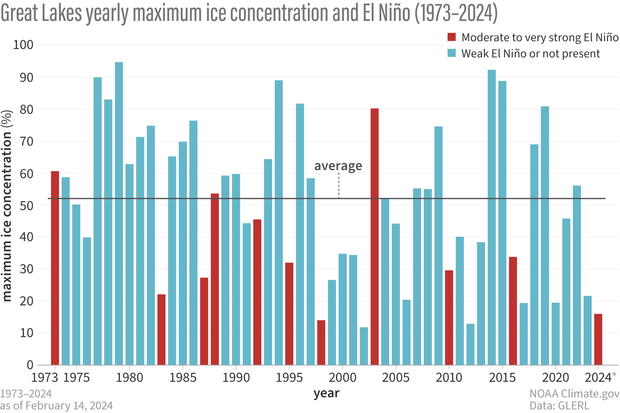
Yearly maximum ice concentration in the Great Lakes showing the influence of El Niño on ice cover. Most moderate or stronger El Niño years (red bars) were below the 1973-2024 average (black line). Other years, including La Niña, neutral, and weak El Niño, are blue. Data for 2024 are preliminary. Image by climate.gov from NOAA's Great Lakes Environmental Research Laboratory data.
Brian Brettschneider, climate expert and Friend-of-the-Blog, took a look at how often winter temperature was above average during past strong El Niños. Overall, we could say around 2-in-3 El Niño winters in the Great Lakes were warmer than average (see footnote). So far, so El Niño.
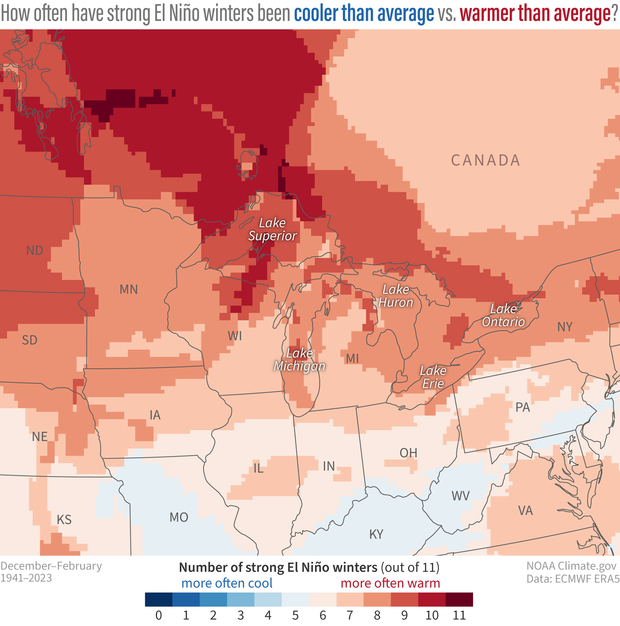
The colors show the frequency of cold or warm winters during the 11 strong El Niños that occurred from 1940-2023. Places where more than half (6 or more) the El Niño winters were warmer than average by any amount are colored red. (Whether a winter was above- or below-average was based on comparison with a 30-year rolling average centered on the winter in question.) Places where more than half the El Niño winters were cooler than average by any amount are colored blue. Most of the Great Lakes region is colored red, meaning that warmer-than-average winters were more common than cooler-than-average winters. NOAA Climate.gov map, based on analysis of ERA5 data by Brian Brettschneider.
There is a lot of variety in those winters, as we can see when we look at each one individually.
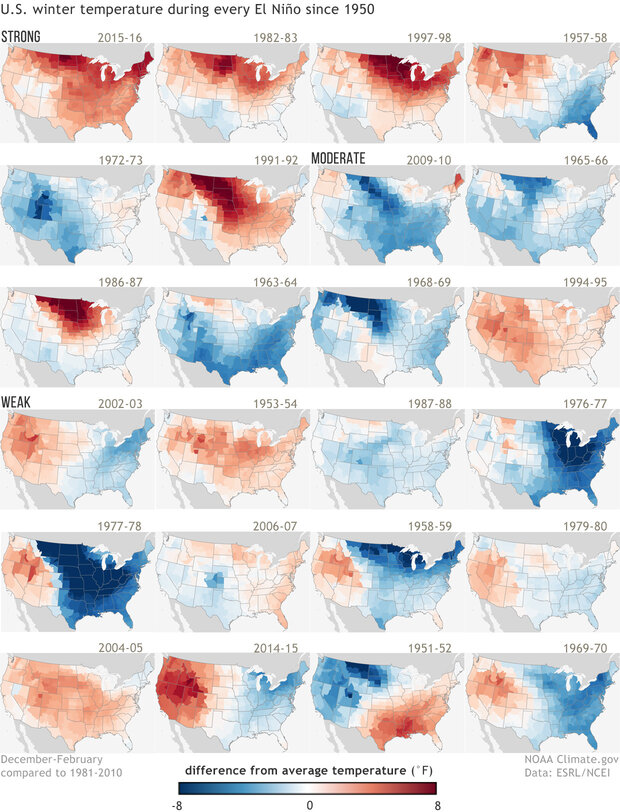
U.S. temperature patterns during the top 20 strongest El Niño winters from 1950-2015/16, arranged from strongest to weakest from top left to lower right. Places where the winter was warmer than the 1981-2010 average are red. Places where winter was cooler than average are blue. All events are somewhat different. In addition, because winters across the U.S. are getting warmer overall, using the 1981-2010 average for comparison can make cold anomalies during early events look especially cold, while warm anomalies may seem rather weak. NOAA Climate.gov maps, based on NOAA climate division data.
While El Niño and its extended Pacific jet stream likely played a role in keeping much of North America abnormally warm, it’s very likely that climate change was also at work here. A few lines in an ENSO Blog post is not enough to attribute what part of the record warmth was El Niño, what part climate change, and what part other factors, including our old friend random variability. As the band is playing me off the stage, though, I can leave you with this picture from Brian, where he’s subtracted the average El Niño impact, based on previous El Niño events, from the 2023–24 winter. As you can see, there is a lot of warmth left on the table that is not consistent with your average past El Niño.
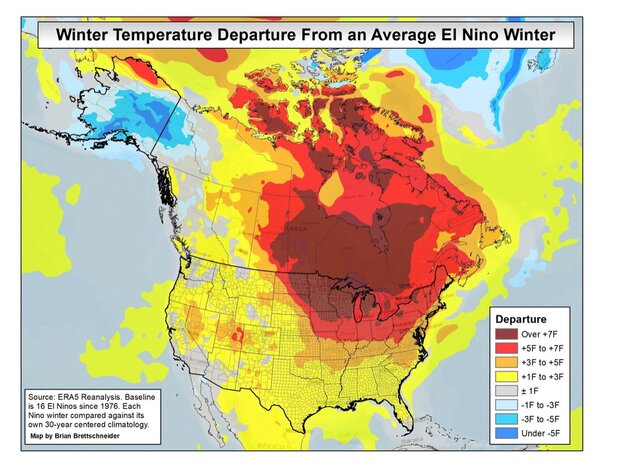
Map showing the difference between the temperature this past winter, 2023-24, and an average El Nino winter. Note that the temperature departure from average was much higher than during an average El Nino. Map by Brian Brettschneider.
Thanks for tuning in! Coming up on the ENSO Blog, we have Nat’s sequel, your regularly scheduled forecast updates, and plenty more as we roll into our second decade.
Footnote
Whether a winter was above- or below-average was based on comparison with a 30-year rolling average centered on the winter in question. These maps are based on the “ERA5” reanalysis from the European Center on Medium-range Weather Forecasting, which covers the global climate from January 1940 to the present. A reanalysis is when scientists use a climate model to fill in gaps in past observations. Many observational records are incomplete, due to stations moving, being discontinued, or missing data. Using a climate model, we can connect the dots between missing data and create a continuous record of the past climate. Reanalysis is an invaluable, widely used technique.
Comments
Comment and Question
Excellent article, but it's still a La Nina watch for 2024 /25. Not carved in stone just yet. We could have a weak El Nino for next winter, or a very weak La Nina, or maybe ENSO / neutral.
Comparing the El Nino event of 2016 with this years El Nino event is like night and day. The event in 2016 had a very strong impact on the Ohio valley, and the 2023 / 24 El Nino event had minimum impact.
Question : The 2016 El Nino event started in a very positive PDO. The 2023 / 24 event started in a negative PDO. I always learned and witness that the El Nino's in past years ( the ones listed in the article ) always started in a positive PDO. This is a major change in the climate, an El Nino starting and dying in a negative PDO. Could this be due to the long solar cycle we have been in the last several years ? The Sun is the major driver of our climate, not Man. Your thoughts please.
Thank you in advance,
Stephen S.
ENSO
You have better odds of winning Powerball next year than experiencing another El Nino year. Not going to happen.
Responses
I am merely a weather enthusiast rather than a meteorologist, so bear with me:
1. From what I have read, there are a number of factors that affect what the winter will be like. Whatever state ENSO is in is just one.
As an example, I remember reading in Fall 2002 how there was supposed to be an El Nino, so I figured that the area I was in at the time (south central Missouri) would have a mild winter. Instead, it was genuinely cold. As another example, the winter of 2022-23 had a La Nina, yet eastern Oklahoma (where I live) was a bit wetter than normal, even though it should have been warmer and drier than normal, based on how La Nina normally affects climate of this area. Meanwhile, this area has had a drier than normal winter this year, even with an El Nino that would normally raise the odds of having a wetter winter than normal. So, I think the most that can be said about whatever state ENSO is in is that it merely increases the probability of the winter being a certain way, rather than it definitely making the weather act one way or another.
2. From what the meteorologists who keep this blog have told me, a big reason why they are forecasting a La Nina to start later this year is because we had a strong El Nino this past winter, and because, whenever those happen, they are often followed by a La Nina. There is a chance that something else could happen, plus, from what the atmospheric scientists keeping this blog have written in the past, springtime tends to make forecasting future ENSO states harder. But, the historical record increases confidence in the forecast for La Nina to develop later this year.
3. I don't know anything about a connection between PDO and El Nino. So, would you explain this further?
4. It is true that the sun is the biggest driver of this planet's climate and weather. In fact, if it were not for the sun, Earth would literally not exist.
It is also true that there are other factors, such as the Moon, how long days last, the oceans, the continents and where they are, mountain ranges and plateaus and where they are, the fact that the Earth is tilted on its axis (as well as how it wobbles very slowly), and the atmosphere along with gases that compose it, among others.
That said, there are some atmospheric gases that store heat, two of which are water vapor and carbon dioxide. (This was discovered in the 19th century.) It was later learned that increasing concentrations of these gases would increase the temperature. And, since the age of industrialization began in the 19th century, human society has been burning fossil fuels (including oil and coal), which has resulted in continually adding carbon dioxide to the atmosphere. We are continuing to do so, so carbon dioxide concentrations continue to go up.
This has resulted in temperatures worldwide gradually increasing for over a century, which has affected climate worldwide in different ways. Here in eastern Oklahoma, for instance, summer has gradually gotten longer, and now routinely continues through most of September, when it used to end around Labor Day (even as recently as 20 years ago). Likewise, winter here has grown milder overall. In Korea, where I lived for 6 years, it has made summers hotter (to the point where they now regularly get the extreme summer humidity that is common in places like Hong Kong but which was rare in Korea 20 years ago). I have no doubt that it is affecting the Ohio Valley as well. There are many other effects of this, which NOAA's many highly qualified atmospheric scientists could tell you about, in detail.
Now, is human-caused global warming the only factor affecting the climate? Absolutely not: As I wrote above, there are a lot of others, plus climate change is never the sole factor affecting climate and weather. To put this another way, while it is a factor, it is not the factor.
So, as they wrote in this post, global warming was a factor in why this past winter was so warm, but it was not the only one.
Though I am merely a weather enthusiast, I have read a fair amount about weather and climate over the years, so I figured I would use it to address the points you brought up.
CO2
Air composition varies horizontally and. vertically. The air over deserts has different proportions of gasses than over jungles. But generally at sea level, Nitrogen is about 78%, Oxygen 20%, Argon 0.9%, CO2 about 0.4%, However, nitrogen and argon do not dissolve well in water. When you heat water, dissolved O2 & N2 escape with water vapour. So ocean warming increases atmospheric CO2, but you never hear that discussed.
Canadian Drought - Potential Wildfires
HI Emily,
The last graphic shows extensive departures from normal over Central and Eastern Canada. Looking at Environment Canada's Drought monitor those regions are also having drought conditions. Unfortunately, I cannot find last year's precipitation anomalies and drought monitor and to determine their relationship with last year's wild fires. If conditions this year will be similar to conditions last year, I am wondering if a high probability of Eastern Canadian wildfires will exist. I know this out of the realm of the ENSO blog, but it might be a good discussion topic.
Thanks, Craig! That's a…
Thanks, Craig! That's a great idea for an upcoming blog post.
Nice data
Wow I am very interested in what's going on here ...
1997-98 El Nino analog
It would be interesting to follow the 2024 March, April, May temperature departure as compared with the 1998 temperature departure, given the close approximation of the past winter's similarity to Winter 1997-98.
Agreed! Great idea.
Agreed! Great idea.
El Nino Impacts in Malaysia
Hi all. After reading the blogs since the announcement of El Nino which also coincided with one of the strongest positive Indian Ocean Dipole in June last year, I am anticipating for drier and warmer than normal weather conditions to occur as these are the typical impacts of co-occurrence of El Nino and positive Indian Ocean Dipole towards Malaysia or Maritime Continent as a whole. However, when I read the sub-seasonal monthly weather reviews since June 2023 until January 2024 issued by the ASEAN Specialised Meteorological Centre (ASMC), I noticed that the rainfall anomalies in Malaysia is either near or above average throughout this period (only September and October showed below average rainfall anomalies for most part of the country) and in fact, Malaysia even experienced prolonged heavy rainfall that leads to big floods in November and December 2023. I also noticed that it rained a bit more frequent where I live (near Kuala Lumpur, west coast of Peninsular Malaysia), the same way it rained during the triple dip La Nina we had recently but it was hot even though it rained frequently. The temperature has been unbearably hot during the day and warm at night since late February. So my question is does these two climate variability phenomenon give minimal impacts to Malaysia in terms of rainfall distribution when they are at a strong level or does this caused by the unprecedented warming of SST around the globe including in the Malaysian waters?
Thank you.
Amirul Hakimi,
a young Malaysian meteorologist in the making.
Thanks for reporting in!…
Thanks for reporting in! Looking at the large-scale precipitation maps, it appears that much of the region was drier than average, but Malaysia itself, as you pointed out, ended up near or above average several months. I suspect this is an example of the unpredictable internal variability, where the big signal (El Nino and +IOD lead to generally drier than average conditions) is predictable, but the smaller-scale activity can end up dominating. There may also be an element of climate change at work, but that will take time to attribute. Keep us posted if you do some of your own analysis of the complex climate in Malaysia.
El Nino Discharge
Would this El Nino discharge process - in particular the ocean currents that are moving that heat poleward away from the equator - subsequently affect moisture/precipitation at higher latitudes? I ask because here in western Washington state, our two "wettest" summers in the last ten years (2016/2019) came on the heels of an El Nino winter that had died out over the spring/summer. Yes, that is only two data points, but just wondering if it is part of a larger pattern. A quick lit review turned up some papers on El Nino decay impacts on precipitation in Asia, but nothing for North America. I do prescribed fire in the summers, and even the smallest rain events can impact our fire effects, so I am trying to determine if we may have a chance of seeing something similar this year as this El Nino dies. Thank you!
Hi Kathryn, Thanks for this…
Hi Kathryn,
Thanks for this question. I found one paper on North American teleconnection impacts during El Nino-La Nina transition, https://journals.ametsoc.org/view/journals/clim/34/9/JCLI-D-20-0761.1.x… , that describes teleconnection patterns that are due to the specific tropical sea surface changes during the El Nino-La Nina transition... maybe another blog post idea!
PDO and ENSO
ENSO / El Nino's, as I've always learned start in a positive Pacific Decadal Oscillation ( PDO, ) whether weak, strong, are very strong. This year's strong El Nino started in a negative PDO, and is now dying in a negative PDO. I just wanted to know why, and has this ever occurred before ??
Stephen S.
ENSO and PDO
I don't have the answers to your questions at the moment - it would take a little digging. Based on this previous work (Fig. 3), the peak correlation between ENSO and the PDO is between 0.6 and 0.7, so it does leave a considerable amount of PDO variability (>50%) that is independent of ENSO. Still, I would think this winter's situation is unusual, but global sea surface temperatures in general have been very unusual over the past year.
El Niño is ruining Wisconsin winter
I want La Niña back El Niño is evil
Add new comment