Ongoing La Niña, above-average Atlantic temperatures set the stage for busy season ahead.
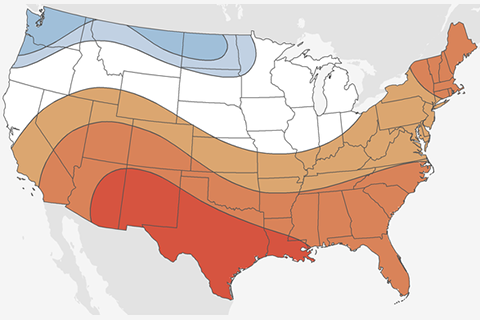
The Climate Prediction Center's Mike Halpert dives into the 2017-2018 winter outlook, and talks about how La Niña winters today are different from La Niña winters of the past.
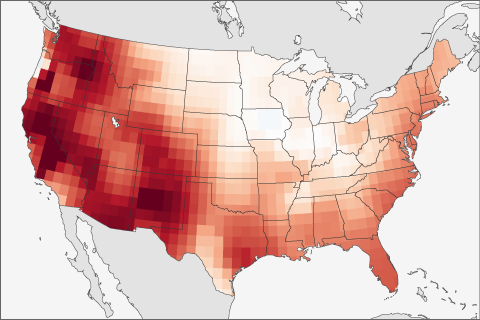
The forecast of ENSO is not the only thing scientists use when making seasonal forecasts. This post looks at another predictor that often is even better to use than ENSO.