Dearest TAO: A love letter to marine-based observations
Oh, my sweet TAO moored buoy array, bobbing ever-so humbly in that great expanse of water scholars call the Pacific Ocean. How I long…nay. yearn, for your daily observations of oceanographic and atmospheric variables. The simple act of looking upon your temperature readings makes my heart flutter with joy. While my life’s journey may never cross upon your moored “shores,” be content with the knowledge of the immense impact your existence has had upon the thoughts of this one modest man. Oh may generations to come delight in your continued work so that they too may feel the joy of science and physics that you bestow upon me.
Forever thy devoted servant,
Thomas
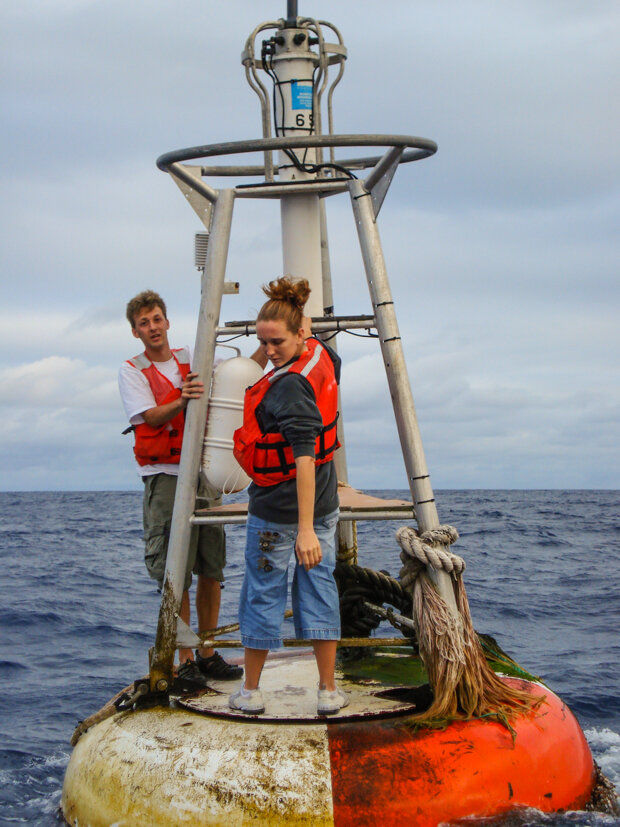
TAO buoy riders. NOAA photo taken on February 11, 2011. Photographer: Lieutenant Elizabeth Crapo, NOAA Corps.
Ok, you may be confused. And I’m sure my editor likely recoiled at how obtuse that opening love letter was. But let me explain. We at the ENSO Blog love ocean and weather observations. And what better way to express that than through my attempt at an 18th century love letter. And what better object of my love than the Tropical Atmospheric Ocean—or TAO—moored buoy array across the equatorial Pacific Ocean. In a world of assumptions when it comes to ENSO, TAO provides something rare for the middle of the Pacific: real-time observations of atmospheric and oceanic conditions.
So you wrote a love letter to a buoy?
Yes! But not just one buoy! TAO refers to a group of around 70 ocean moorings anchored to the sea floor across the equatorial Pacific Ocean. These buoys measure atmospheric things like the winds, relative humidity, and air temperature and oceanic things like the sea surface temperature. One of the most important things the buoys measure is temperatures of the ocean at 10 depths in the upper 500 m (1640ft) of the ocean (more on why these matter later).
The moorings are placed along a north-south line from the western Pacific (165°E) to the eastern Pacific (95°W), as if placed by the most methodical Battleship player ever. And their placement in this specific area of the world is not random. TAO exists to help monitor and study climate phenomenon across the Pacific with a heavy emphasis on El Niño and La Niña.
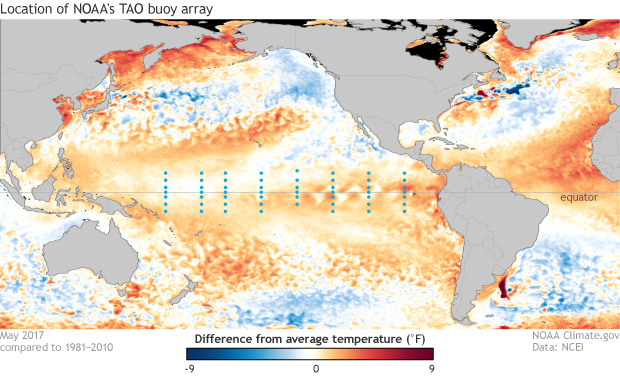
Plotted in blue circles are the sites of NOAA's TAO moored buoy array located across the equatorial Pacific Ocean. Shaded in the background are the May 2017 sea surface temperature anomalies where red areas represent warmer than average conditions and blue areas represent colder than average conditions. The TAO buoy array helps scientists monitor and understand ENSO. NOAA Climate.gov image with sea surface temperature data from the National Centers for Environmental Information and TAO buoy data from NOAA's National Data Buoy Center.
These one-of-a-kind oceanic moorings owe their existence to a large international climate research program called the Tropical Ocean Global Atmosphere program , or TOGA, which began in 1985, shortly after the 1982-83 El Niño—one of the three strongest on record back to 1950--caught scientists off-guard. TOGA’s mission was to help figure out how predictable tropical phenomena (like ENSO) are on seasonal to multi-year timescales, and how much observations in the tropics could improve climate predictions.
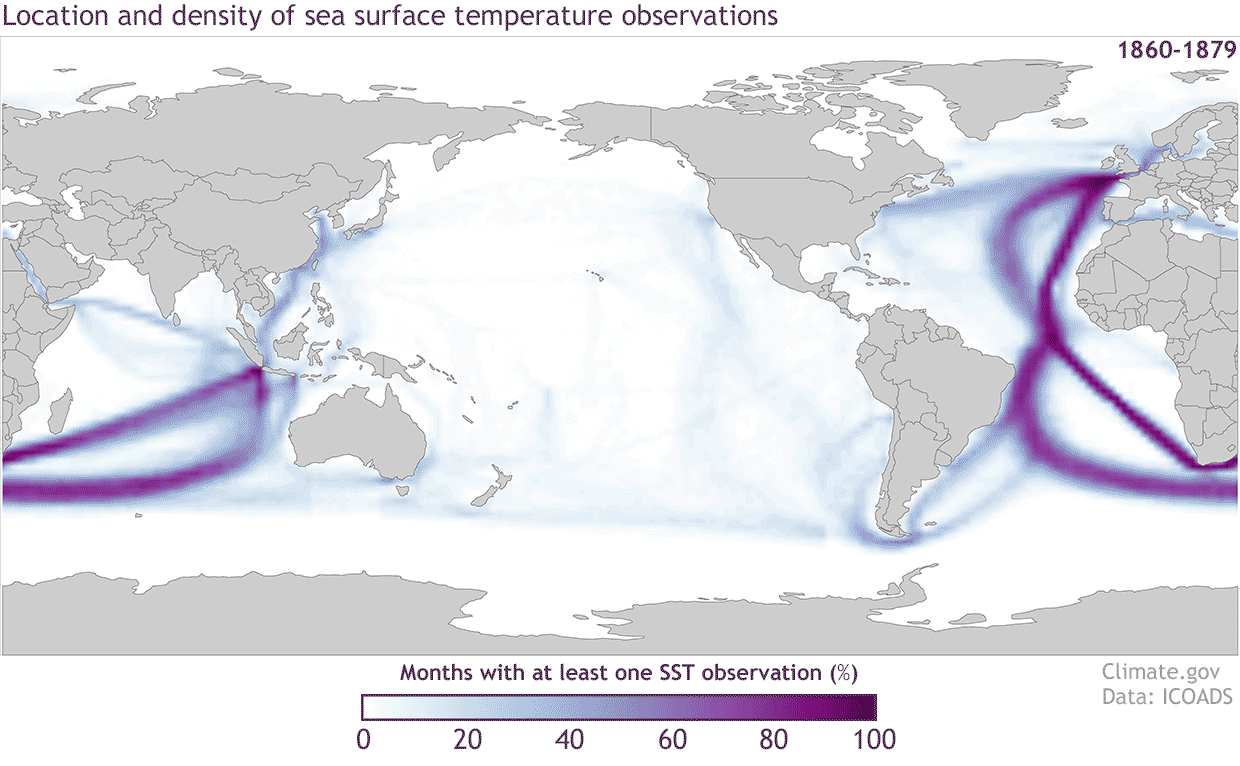
Locations of sea surface temperature observations from the International Comprehensive Ocean Atmosphere Data Set (ICOADS) for 20-year periods starting with the 1860-1879 period and ending with 1980-1999. The colors represent the percentage of months with at least one sea surface temperature measurement in each 2 degree by 2 degree grid box. The darker the color the higher the percentage of months in each 20-year period that has an observation. NOAA Climate.gov image with data from ICOADS.
I get how TAO came about, but so what?
Prior to TOGA and TAO, there simply were not many observations across the Pacific Ocean to help scientists predict and understand ENSO. Scientists were like a person walking around with poor vision and no glasses. And when the ENSO picture is blurry, it can mean that even one of the strongest El Niños on record can catch the world by surprise, leaving little time for communities to prepare for the flooding and droughts that occur during El Nino.
While there were some ocean observations from ships, buoys and satellites, nothing with the capabilities of the TAO existed until…well, TAO. This includes TAO’s ability not only to measure the surface but also the sub-surface in the equatorial Pacific Ocean. As Michelle has written about previously on the blog, the subsurface can be where all the “action” is in a developing El Niño and La Niña, as that is where oceanic Kelvin waves reside. In fact, the first demonstration that an “oceanic Kelvin wave” actually helps to move warmer sub-surface water east during El Niño was very new in the early 1980s. Thanks to TAO, scientists now literally see it and more importantly can track it in near-real-time. One classic example of this is how well TAO captured the 1997-1998 El Niño, which is widely regarded as the strongest since 1950. After the disaster of not seeing the 1982-83 event until it was too late, scientists--using observations like TAO--were able to forewarn the world many months prior to the peak of the 1997-98 event.
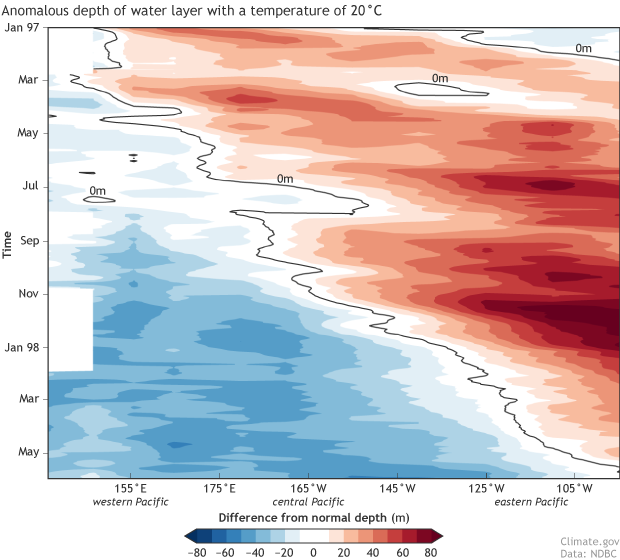
A time-longitude graph, or hovmoller diagram, of the anomalous depth of the 20°C isotherm (line of constant temperature) was across the equatorial Pacific Ocean (2°N to 2°S) during the 1997-1998 El Niño event as recorded in a 5-day running average by the TAO moored buoy observations. The metric shown is the anomaly (departure from long-term average) in depth of the layer of ocean water with a temperature of 20°C. If this layer is lower than usual (positive values), that means more warm water. If the layer is higher than usual (negative values), there is less warm water than average. The dark line represents a 0m anomaly. NOAA Climate.gov image from data processed by the Instituto Geofisico Del Peru using the 1981-2010 climatology obtained from the NCEP Global Ocean Data Assimilation System (GODAS). TAO buoy data available from NOAA's National Data Buoy Center.
Plus, once the observations in the Pacific Ocean came online, they were put into our climate models, greatly improving the models’ ability to predict ENSO events. The key revolutionary aspect of TAO was the ability to make subsurface temperature observations. Research has shown that TAO data has reduced the uncertainty—made things less blurry—in tropical Pacific temperature analyses which are used not only to monitor ENSO but also to provide the initial view of the ocean in seasonal forecast models across the globe (Xue et al 2017). After all, just like a person with 20-400 vision putting on their first set of glasses, models tend to “see” the future better if they start with a more accurate view of the current state of the ocean and atmosphere.
Ok, I can maybe see why you wrote a love letter to buoys…maybe. Anything else?
Well, their data can be found in hundreds of scientific journal articles, as TAO has been the predominant source of observations in the upper portion of the equatorial Pacific Ocean since the mid-1980s. In that time, TAO has not only become our global watchdog for developments in the Pacific Ocean but also has become vital in our ever-deepening understanding of just what makes ENSO tick. It has been TAO data, for instance, which has helped to corroborate current pre-eminent theories on ENSO formation. And will continue to do so for as long as TAO floats across the Pacific.
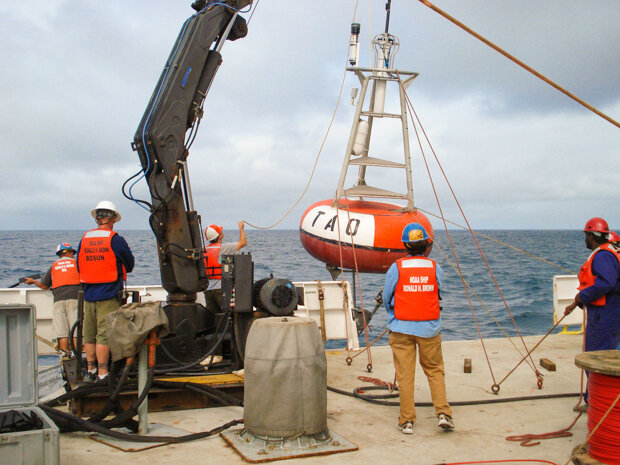
Deploying a TAO buoy. TAO is a moored buoy array maintained by NOAA located across the equatorial Pacific Ocean. Its surface and sub-surface observations are critical for our understanding of ENSO. NOAA photo taken on February 11, 2011. Photographer: Lieutenant Elizabeth Crapo, NOAA Corps.
I’m convinced. TAO FOREVER!
Hopefully! But it’s important to note that after all these years, TAO’s continued existence has never been a guarantee. TOGA, the program which gave us TAO, ended in 1994. Since then TAO has been supported by a myriad of sources. Currently, it is supported by NOAA as part of the operational ENSO observing system. It is important that we keep these buoys around. We wouldn’t want to lose our ENSO glasses.
So I am glad that I could show some love to some incredibly important marine-based ocean observations. Now if you’ll excuse me, I think I’ll go see what TAO is reporting today.
References
McPhaden, M.J., A.J. Busalacchi, D.L.T. Anderson, 2010. “A TOGA retrospective.” Oceanography. 23(3). 86-103. Doi:10.5670/oceanog.2010.26.
Xue, Y., C. Wen, A. Kumar, M. Balmaseda, Y. Fujii, O. Alves, M. Martin, X. Yang, G. Vernieres, C. Desportes, T. Lee, I. Ascione, R. Gudgel, I. Ishikawa, 2017: “A Real-time Ocean Reanalyses Intercomparison Project in the context of tropical Pacific observing system and ENSO monitoring”. Clim. Dyn., DOI: 10.1007/s00382-017-3535-y.
Comments
Great Info
crew manning company in Mumbai
Add new comment