It's not the heat; it's the humidity
We live in a warming world. And we often characterize that warming through metrics of temperature. But that’s only a sliver of the story. Another sliver, and perhaps a more consequential one, of the story is the connected increase in atmospheric moisture.
Recent months have brought us—yet again—real-world examples of what these increases in moisture can bring.
To say it’s been a wet year in the mid-Atlantic is an understatement. Through August, that is to say, before Florence, we were already working on the wettest year on record, or close to it, in much of the region.
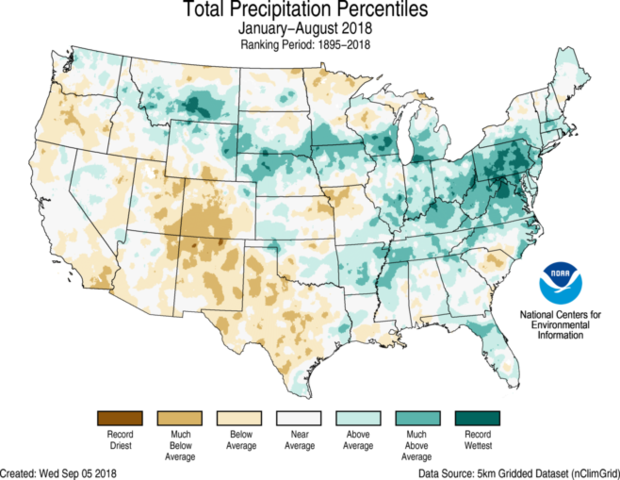
January-through-August precipitation ranks for the contiguous United States. The darkest green areas saw record high precipitation for that eight-month period. The medium green indicates places with Jan-Aug precipitation in the top ten percent of history. The lightest green shade indicates areas with precipitation totals in the top one-third of history. The period of record dates back to 1895. From NCEI's US State of the Climate report for August 2018.
Once Florence’s rains are factored into the end-of-September analyses, we’ll see much more dark green in the Southeast and mid-Atlantic.
What does that have to do with warming? Taken individually, not a lot. But taking the larger history into context, this is a continuation of a signal we’ve seen in recent decades, especially east of the Rockies: it’s getting wetter. 2018’s rank as the wettest year on record (to date) for parts of the East just reinforces this trend.
So, what does that have to do with warming? Again, it’s complicated, because precipitation is the end result of several atmospheric ingredients and processes, but to oversimplify: a warmer atmosphere can hold more water vapor, and an atmosphere with more water vapor can make more precipitation.
But the bigger and more consequential change we’ve seen is how much rain can and does fall in an event. I’m going to call that “Big Rain” as shorthand. What I mean by “event” is something meteorological in scale, lasting a day or two or maybe three.
I should stop here, as an aside, and say there are a multitude of ways to define “Big Rain.” One way that the National Climate Assessment has chosen is to define Big Rain as the top 1% of daily totals from the reference period of 1961-90.
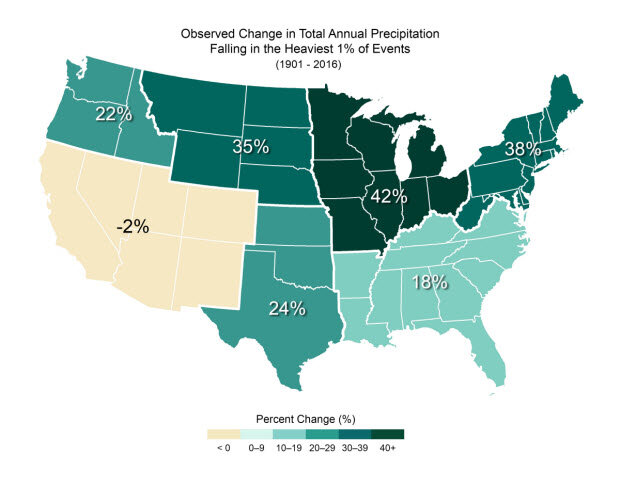
This indicator shows the increase or decrease of the amount of annual rainfall that comes in the form of very heavy precipitation. For this indicator, very heavy precipitation refers to events in the top 1% of those occurring during the reference period of 1961-90. From the National Climate Assessment Climate Science Special Report, and the US Global Change Research Program's Indicator Platform.
By this indicator, most of the country has seen dramatic increases in Big Rain. You can learn more about this indicator here.
By NCEI’s Climate Extremes Index—another way to diagnose changes in Big Rain—it’s increasing, too. Component 4 of the CEI is dedicated to one-day rainfall totals. That trend is up, with a bullet.
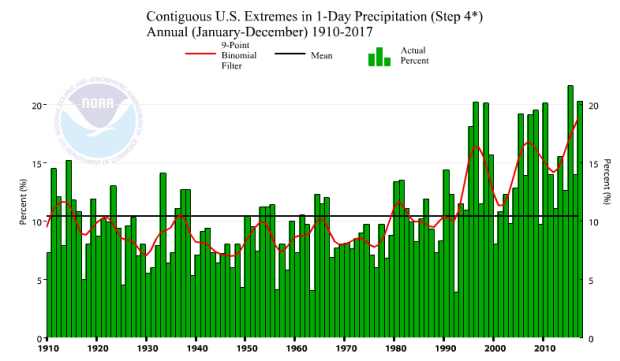
NCEI's Climate Extremes Index Component 4 shows how much of the US was subject to greater than normal proportion of precipitation derived from extreme 1-day precipitation events. The increase in recent years means that more of the US is subject to increased very heavy one-day precipitation.
How is that tied to warming? The same way: a warmer atmosphere can hold more water vapor and an atmosphere with more water vapor can make more precipitation. And the warmer it gets, the higher the theoretical “Big Rain” events can get. That’s playing out in the data, pretty much any way you look at it.
These two trends—wetter conditions overall, and bigger Big Rain—are exemplified in this plot for Wilmington, NC. This plot, often called a “Haywood Plot,” shows the cumulative precipitation for about 70 years at Wilmington. Each line on the graph shows a year’s progression in total precipitation. The driest five years are plotted in brown; the wettest years in mint, with 2018 highlighted in light NOAA blue.
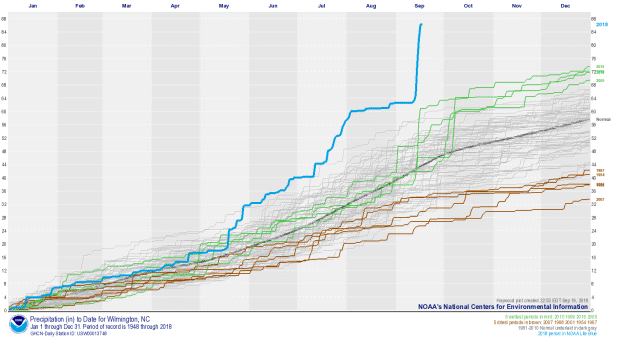
This Haywood plot for precipitation at Wilmington, NC shows how each year's cumulative precipitation played out. The 2018 precipitation (through September 16) is in the thick, blue line. The other four years that make up the five wettest on record (with 2018) are shown in mint, while the five driest years are shown in brown. The other years are shown as grey. 2018 became the wettest year on record at Wilmington with more than 100 days left in the year. Haywood plots are often included in the supplemental materials associated with NCEI's monthly US State of the Climate reports.
Look at 2018. Even before Florence, Wilmington was experiencing the wettest year-to-date on record, with the blue line outpacing its “rivals” in the field. Florence’s totals pushed that line into—literally—uncharted territory. Even if no rain were to fall in the next 100 days, 2018 will be the wettest year on record at Wilmington by almost a foot.
But what’s more interesting, looking beyond this year’s data, are the spikes. Each of those five wettest years has a large spike in September or October. And each of those spikes—indicating a huge increase in precipitation over the span of just a day or two or three—came courtesy of a named storm. Specifically, 2005’s Ophelia, 2016’s Matthew, and 1999’s Floyd, which made landfall in the region, and 2015’s Joaquin, whose moisture was entrained into massive rains over the Carolinas.
The other years don’t have these huge spikes. Sure, it’s kind of intuitive that the years with the biggest spikes would have the highest totals, but what’s not so obvious is all five of those years have happened in the last 20 years. The previous 50 years? Not so much.
And that brings us back to hurricanes and tropical storms, or “tropical cyclones” for short. We’ve long known that generally speaking, warmer means more intense storms and more potential rainfall, but the latest piece of knowledge on tropical cyclones is that they appear to be slowing down, for reasons that aren’t entirely clear.
Why does that matter? Slower storms can dump more rain on a place, and when that place is coastal land, it can bring catastrophic flooding. We definitely saw this with Harvey and Florence.
These factors—an atmosphere more laden with water vapor making more rain, and making more rain in larger doses, and the change in forward speed of tropical cyclones—are connected to our very real observations of more precipitation. It’s something we’ll need to build for, warn for, and work on.
Thanks for going Beyond the Data.
Comments
something to think about
Learn English, Please
RE: Learn English, Please
Thanks, point taken. I think the planet of this comment.
RE: Learn English, Please
Increased rain fall
RE: Increased rain fall
Hi Alan. Sorry this comment languished in the inbox for so long. Here are some quick responses:
Doesn’t increase rainfall actually (in the long run) decrease air temperature?
It sounds like you're asking whether this increased heavy rainfall will somehow reverse the warming due to greenhouse gas increases. The answer to that is no. The process of evaporation and rainfall can only move heat energy from one part of the atmosphere to another. It takes energy to evaporate water from the surface, and that latent heat is carried by the water vapor molecules up into the higher, colder parts of the atmosphere. Eventually, it reaches a place where the ambient air is too cold for water vapor to remain in a gas state. As the water vapor condenses into liquid water or freezes into ice crystals, it releases that latent heat energy that evaporated it back into the atmosphere. The process cools the surface, but it warms the atmosphere where it rains. Heat energy is recycled, but not removed from the system.
How do we know if this is a unique event without knowing temperature and humidity data from other more distant historical time periods?
I'm not totally sure what you are referring to when you say "a unique event." This post is about a long-term trend in heavy rain. So, the point of the post was not that the amount of heavy rain we receive today is unique in all of Earth history. The point was that the heaviest rainfall events we experience today are bigger than the heaviest rain events that occurred a hundred years ago. This is significant because our modern infrastructure and ag systems are designed to handle the old climate, not the new one.
How do we know if we aren’t still coming out of the ice age, or going back in to another ice age?
I recommend this peer-reviewed scientific paper that addresses that very question.
Add new comment