Can volcanic eruptions cause El Niño? Maybe, maybe not
It may seem like I randomly spun a Climate/Earth Phenomena wheel, landed on volcanoes, landed on ENSO, and then decided to do a piece connecting the two. But it makes more sense than it may seem. Volcanic eruptions have had HUGE impacts on the global climate by cooling Earth (1). It’s only natural to wonder, if the planet is affected by volcanic eruptions, can ENSO be? (Full disclosure: As with many things climate related, the answer to this question will be like the final episode of Lost; likely to leave you unsatisfied, maybe even a bit angry, yet wanting more.
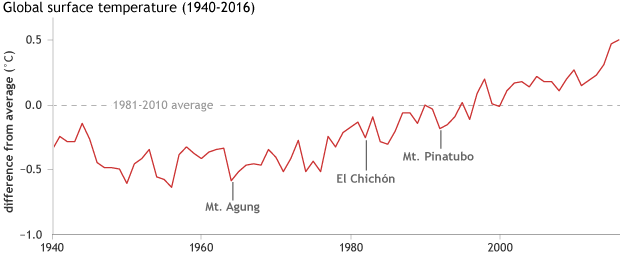
Global surface temperatures since 1940 compared to the 1981-2010 average (dotted line). Three tropical volcanoes had climate-cooling eruptions in the second half of the twentieth century: Indonesia's Mt. Agung in 1963, Mexico's El Chichón in 1982, and the Philippines' Mt. Pinatubo in 1991. NOAA Climate.gov graph, based on data from NCEI.
Do volcanoes affect ENSO, and why should we care?
Why care? We can learn a lot about how much we know something when that thing is under a lot of external “stress.” So using volcanic eruptions is a great way to test our knowledge of ENSO and the processes that can push it around (2).
Do they influence ENSO? Yes? No? Maybe. After two major volcanic eruptions in the tropics in the late twentieth century (Mt. Pinatubo in 1991, El Chichón in 1982), the globe cooled over the next year and the tropical Pacific shifted into an El Niño a year after. A study using climate models, specifically of the Mt. Pinatubo eruption, seemed to indicate that the volcanic eruption primed the tropical Pacific to shift into an El Niño by reducing the tropical trade winds, which can kick start El Niño with warm water sloshing to the east (3).
So why am I saying maybe? Climate models have biases when it comes to not only capturing ENSO but also in simulating the effect of volcanoes on the climate. These findings definitely suggest a volcanic impact but it’s no slam dunk. There are not a lot of cases in our reliable observational record (4), and even testing the few cases we’ve seen relies on using models that have their own faults. So what can scientists do?
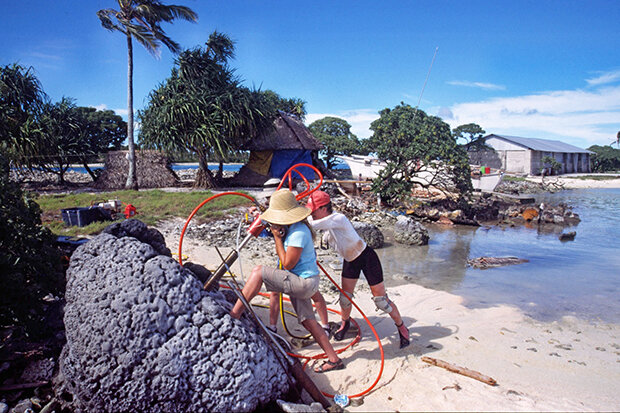
Core extraction from fossil coral located in the Line Islands by Dr. Kim Cobb and her lab. Photo Credit: Dr. Kim Cobb and the Cobb lab
Paleoclimate data to the rescue!
Easy! Just go out and collect tree ring, or fossil coral, ice or sediment core data that capture the climate going back a thousand years, and reconstruct datasets that estimate ENSO and volcanic eruptions. Simple! Okay, I’m being sarcastic. Not only is the statistical work of reconstructing past climates quite tricky, but um, paleoclimate data isn’t gonna collect itself. And the locations where you can get those things tend to be remote ones.
Luckily, scientists have gone out and collected various cores and tree ring data that let us peek at the state of ENSO going back in some way 700 to 7000 years. The multiple datasets allow us to test this volcano-ENSO relationship using independent data.
But remember when I said this article might frustrate you and make you angry? (HEY LOST, WHAT WAS THAT OUTRIGGER CHASE ABOUT?! Sorry…I digress, but seriously SO frustrating). Well, paleoclimate datasets can “disagree.”
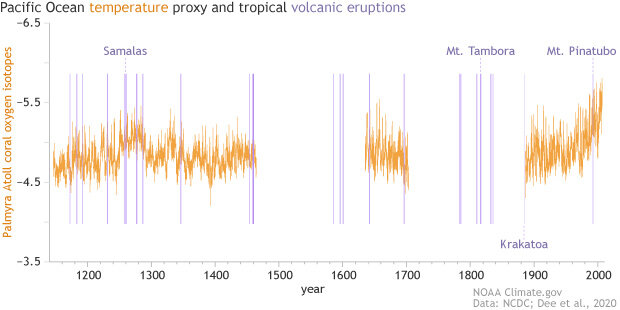
A paleoclimate reconstruction of the state of ENSO (orange) from 1147 C.E. to 1998 C.E. using fossil coral cores taken from the Palmyra Atoll plotted along with a history of major tropical eruptions of volcanoes (purple lines) spanning that time frame. Climate.gov image using data from NCDC and Dee et al. 2020.
But how? And why? And huh?
Let’s talk about some of these paleo-ENSO records.
Option a: One paleoclimate study led by Dr. Jinbao Li used tree rings in seven regions known to exhibit strong ENSO responses to reconstruct ENSO from 2005 back to 1301 C.E. (Li et al., 2013). These tree rings were located in Asia, New Zealand and North/South America. This ENSO reconstruction was then compared to modern records of tropical Pacific sea surface temperatures and found to be reasonably similar. This gave scientists confidence that their reconstruction would be valid for the past.
In this reconstruction, scientists found that after large eruptions of volcanoes in the tropics (they identified 22 events), there was a pronounced response: ocean and global temperatures cooled immediately after the eruption, and warming occurred in the tropical Pacific in the following year. Based on this analysis, it definitely seems plausible that eruptions lead to El Niño. But then…
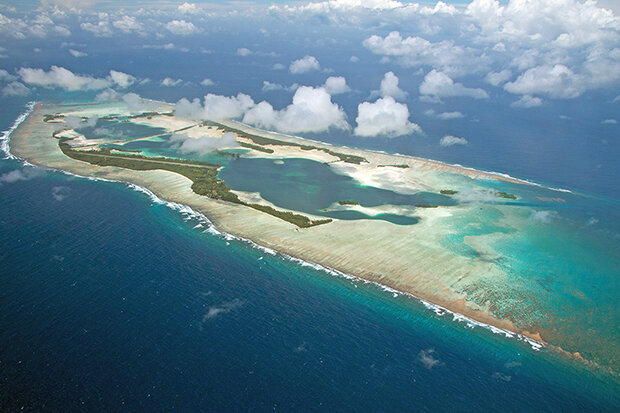
Palmyra Atoll NWR taken June 29, 2011. Photo credit: Erik Oberg/Island Conservation. CC license
Option b: A more recent ENSO reconstruction study led by Dr. Sylvia Dee (Dee et al., 2020), though, used fossil coral found smack dab in the middle of the central tropical Pacific Ocean at Palmyra Island (5). This coral reconstruction of ENSO allowed scientists to look back a little further, to around 1150 C.E., but the record was not continuous; it had gaps from 1465-1634 C.E. and 1703-1886 C.E. (6). When compared to the modern ENSO record, it was found to be even more similar (7) to ocean temperatures in the Niño3.4 region than the tree-ring reconstruction!
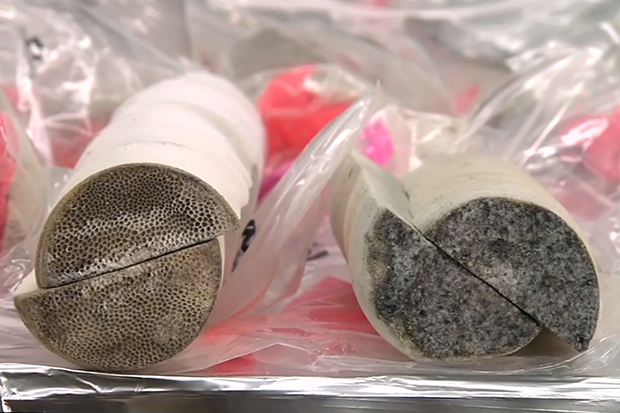
Fossil coral cores which can be used to create paleoclimate records. Photo credit: Cobb Lab, Georgia Tech
Yet, when the scientists compared this newer coral-based ENSO reconstruction to the largest volcanic eruptions within the same period—ID'd by volcanic sulfate residue found in ice cores in Greenland and Antarctica—there wasn’t a clear ENSO response. The scientists found a hint of an El Niño response for large eruptions (8), but the signal was not strong enough for a confident attribution. For instance, the largest eruption in the last 900 years, the 1257 Samalas eruption, had no subsequent El Niño. (Head to the footnotes to see how the scientists also showed that climate models’ ENSO response to the volcanic eruptions was overdone. (9))
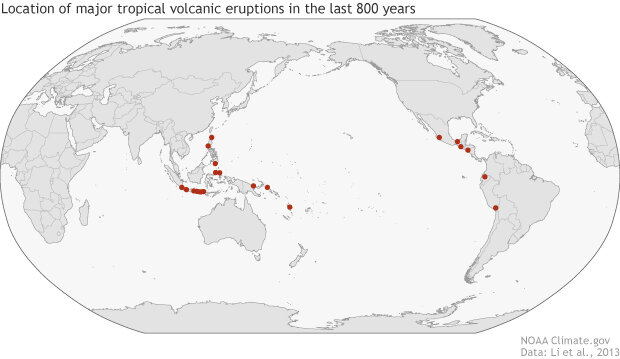
Location of tropical volcanoes that erupted during roughly the last 800 years which had a global climate cooling impact. Volcanoes are taken from a list in the Li et al. 2013 paper with the addition of the Samalas volcano which erupted in 1257 and was the largest during the time frame. Climate.gov image using data from Li et al. 2013.
So what do we believe? Two datasets. Two different conclusions. Why? (A) Like any real estate agent would say: Location, Location, Location! The reconstructions of ENSO were done using different types of paleoclimate data found in completely different areas. The newest record came from the heart of the tropical Pacific, while the older dataset relied on records from areas that normally show specific responses to El Niño and La Niña. Like a game of telephone, the fossil coral is like the first person told the message while the tree ring dataset is like the fourth person. (B) The eruption dataset used for comparison was different. The two datasets ended up using lists of volcanic events with only a couple crossovers (10). And (C), the newer record went 170 years farther back in time but wasn’t continuous. Of the top ten most volcanic eruptive years used by the coral reconstruction comparison, six of them occurred from 1150 C.E. to 1300 C.E. which means they were missing in the tree ring reconstruction analysis. Meanwhile, major volcanic eruptions like Mt. Tambora in 1815 fell into the gaps of the coral reconstruction and weren’t used.
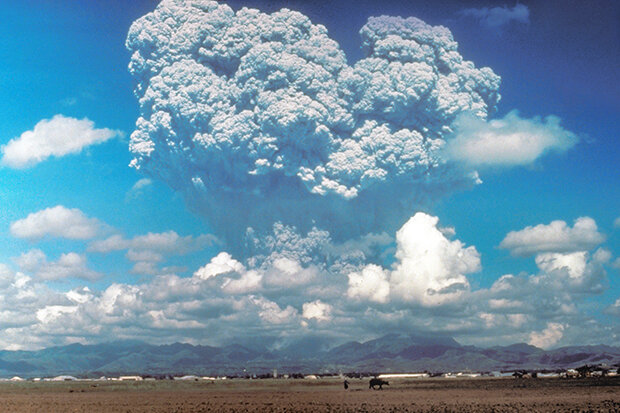
The June 12, 1991 eruption column from Mount Pinatubo taken from the east side of Clark Air Base. Photo courtesy of the USGS.
So you know nothing, John EN-SnOw. (Don’t get me started on how that show ended)
We know enough to know we can’t make any definitive claims. Importantly, the coral reconstruction research is neither denying nor confirming that volcanoes caused El Niño-like anomalies the year after an eruption. But given how ENSO normally acts (how variable it is), it’s incredibly hard to say if the response seen after volcanoes is from the eruption or just part of the intrinsic nature of ENSO. Basically, ENSO is like a teenager. A teenager by definition will do whatever a teenager wants to do, both good and bad. And while you may think that any decision that teenager makes is because of your parenting, it’s hard to say with any confidence. And also because they’d never admit it anyway.
And that’s what makes doing climate and ENSO science so hard. Sometimes the climate and ENSO won’t “admit” when something is influencing it. So I apologize that I never gave a concrete answer about volcanoes’ influence on ENSO, but sometimes “we don’t know yet” is the best we can do. Science is hard.
Footnotes:
(1) In 1815, the massive eruption of Mt. Tambora in Indonesia ejected enough ash, dust and tiny particles known as sulfate aerosols into the troposphere and stratosphere to cover the globe, blocking sunlight and leading to global cooling and the “Year without a summer”. Other major global cooling events due to volcanoes include Mt. Krakatoa (1883) in Indonesia, Mt. Pinatubo (1991) in the Philippines and El Chichón (1982) in Mexico. Volcanoes that erupt in the tropics have the ability to spread their sunlight blocking sulfate aerosols across the entire globe due to the wind patterns in the troposphere and stratosphere.
(2) Why care? Volcanoes are well known to externally force major changes to Earth’s climate and have been occurring with geological regularity for thousands of years. And better yet, the events are detectable in tree rings, ice cores and coral. Plus, one potential geoengineering solution to climate change is to inject sulfate aerosols into the stratosphere to cool surface temperatures, which is exactly the mechanism that cools the planet when tropical volcanoes massively erupt. This might have all sorts of negative side effects, but it requires study to find out what those are, and that includes impacts on ENSO.
(3) This is a somewhat simple explanation for how volcanoes might prime the Pacific to cause an El Niño event a year after an eruption. One proposed mechanism is that the preceding year’s aerosol-driven cooling can also force a southward retreat to the Intertropical Convergence Zone (ITCZ), the location where the trade winds from the northern/southern hemisphere meet. This shift also acts to produce an El-Niño-like reduction of the trade winds over the tropical Pacific. Another proposal notes that the volcanic cooling immediately after the eruption may have a quicker and larger cooling impact on the Western pacific than the eastern Pacific, reducing the gradient. This is due to the deeper thermocline and less upwelling in the western Pacific than the eastern Pacific with its strong upwelling and shallower thermocline. The reduced gradient between the west and east Pacific leading to reduced trade winds which jump start El Niño.
(4) What do I mean by reliable observation record? We have a good amount of direct temperature measurements (buoys, ships) of the tropical Pacific starting in 1950 to today for a reliable historical record of observations. Prior to this, direct measurements were a lot sparser so the errors in the ENSO measurements are larger. I covered some of these issues in this previous ENSO blog article. Going back even farther, paleoclimate records of ENSO also come with caveats as they are not directly measuring ocean temperatures but using proxies and assumptions. Some paleoclimate records also only give information in yearly increments, meaning they are not able to resolve things like the seasonal cycle. The coral reconstruction actually allows for monthly increments. But the key aspect is that each record before the modern record comes with various errors that have to be taken into account.
(5) How are fossil coral so good at replicating ENSO? We can measure the amount of oxygen isotopes in the fossil coral. The d18O is the ratio between two oxygen isotopes 18O and 16O. When d18O values are low, it corresponds to warm, wet and El Niño-like conditions. High d18O values correspond to cool, dry, La Niña-like conditions.
(6) To create a paleoclimate dataset out of fossil coral, you first need to find fossil coral boulders from a variety of time periods. The reason there are gaps in this dataset is simply because no fossil coral dating to those periods was found.
(7) When I say "more similar," I mean that the correlation between the coral ENSO reconstruction and the modern record is higher than that of the tree ring ENSO reconstruction.
(8) Of the six largest eruptions, four actually showed a shift towards El Niño-like anomalies in the years after. Yet when the authors tested significance of eruptions of various strength, none showed a statistically significant ENSO response. Events that were twice as strong as Mt. Pinatubo (1230, 1257, 1458 and 1641 C.E.) came closest to reaching a statistically significant connection with ENSO, but the uncertainty still meant that overall, the reconstruction did not support a detectable ENSO response.
(9) The scientists who created the coral paleoclimate record also compared their results to climate model simulations of ENSO before and after the six largest eruptions (models were run from three years before to six years after the eruption) to their coral record. Most of the climate model ocean temperature response to the volcanic eruptions was considerably warmer or cooler in the tropical Pacific than what the corals indicated. In fact, the model used in the Mt. Pinatubo study showed a much larger warming than the coral record. This suggests that some climate models may overdo the ocean temperature response to volcanoes.
(10) There are different ways of defining how strong an eruption is leading to different lists of big events. The tree-ring paleoclimate comparison used the Volcanic Explosivity Index (VEI) to define the level of events, while the coral paleoclimate comparison used a more recent dataset called eVolv2k, which uses the amount of sulfur ejected into the stratosphere as determined by sulfate deposits found in ice cores in both the Northern and Southern Hemispheres. Specifically, the coral dataset looked at the stratospheric optical depth of eruptions. Think of this as how much sunlight was able to penetrate the stratosphere. Less sunlight, the bigger the eruption. This leads to different lists of volcanic eruptions to compare to the state of ENSO.
References
Dee G. S., K. M. Cobb, J. Emilie-Geay, T. R. Ault, R. L. Edwards, H. Cheng, C. D. Charles (2020), No consistent ENSO response to volcanic forcing over the last millennium, Science, 367, 1477-1481, DOI: 10.1126/science.aax2000
Li, J., Xie, S., Cook, E. et al. El Niño modulations over the past seven centuries. Nature Clim Change 3, 822–826 (2013). https://doi.org/10.1038/nclimate1936
Predybaylo, E., G. L. Stenchikov, A. T. Wittenberg, and F. Zeng (2017), Impacts of a Pinatubo-Size Volcanic Eruption on ENSO, J. Geophys. Res. Atmos., 122, 925–947, doi:10.1002/2016JD025796
Comments
Very interesting post. It
RE: Very interesting post. It
I'm not aware of literature that suggests a link between earthquakes and ENSO and also changes in pandemic emissions and ENSO (and it's probably very unlikely). Interesting questions and I am glad you enjoyed the post.
they already have
in 96 in 97east coast usa was haveing a winter with snow in may caused by elnino caused by volcanos under the ocean floor in mexico
valuable information
General
Not enough data
Great
Well, a good analysis!
Underwater Volcanic Activity vs El Nino or La Nina
Although information regarding volcanic activity on land is available, I sense that there is more climate/weather related influence from underwater volcanic activity than is being discussed. I'm reminded of the airline passenger leaving Australia or New Zealand looking out the window and seeing a massive blob in the ocean. Turns out is was a hugh floating island of lava. Further investigation revealed an underwater field of volcanos, one of which was one of the largest ever encountered.
Given how vast the oceans are, I realize it would be extremely difficult to track or monitor underwater activity, but perhaps surface temps of the ocean would provide some insight.
The ring fire and underwater volcanos affecting El nino
Just a question from an uneducated person.
when maps of the ring of fire are lined up with the currents of El nino and the possible heat collected from the mass of floating garbage in the pacific be enough heat to change climate?
ENSO and Mount Pinatubo eruption
Very well written article - leaves me where I left off in graduate school in 1988! Back then volcanic eruptions were theorized as a cause of ENSO and in my opinion, they are still in the lead for the most likely cause. I wanted to weigh in with a personal observation. In late May of 1991 I transited the Strait of Malacca and noted that the ITCZ was still over the equator (in my estimate, about a week late in moving into the Southern Hemisphere). From this, I predicted that it would be sunny when we arrived in the Philippines on June 7th, even though the seasonal monsoon shift generally occurs on the first of June. I also predicted that the Monsoon rains would start on June 8th. I was correct on both counts. Pinatubo erupted a few days later. My theory at the time was the causative factor for the ITCZ being out of place was the black smoke from the oil well fires in Kuwait caused by Iraqi forces during Desert Storm.
I also wonder out loud if the Mount St. Helens eruption in 1980 may have played a part in the 82-83 ENSO?
ITCZ and aerosols
Thank you for sharing your experience. I am not aware of any studies that specifically investigated the effects of oil well fires on tropical weather and climate, but anthropogenic aerosols are believed to have had a significant impact on ITCZ position, as described, for example, in this study.
Add new comment