November 2020 La Niña update: just us chickens
La Niña strengthened over October, with both the tropical Pacific Ocean and the atmosphere clearly reflecting La Niña conditions. Forecasters estimate at least a 95% chance La Niña will last through the winter, with a 65% chance of it hanging on through the spring.
The October sea surface temperature anomaly (departure from the long-term average) in the Niño 3.4 region of tropical Pacific was -1.3°C according to the ERSSTv5 dataset, substantially cooler than the La Niña threshold of -0.5°C. This is the eighth-strongest negative October value in the ERSSTv5 record, which dates back to 1950. I’ll talk more about feats of strength (vis-à-vis La Niña, that is) later.
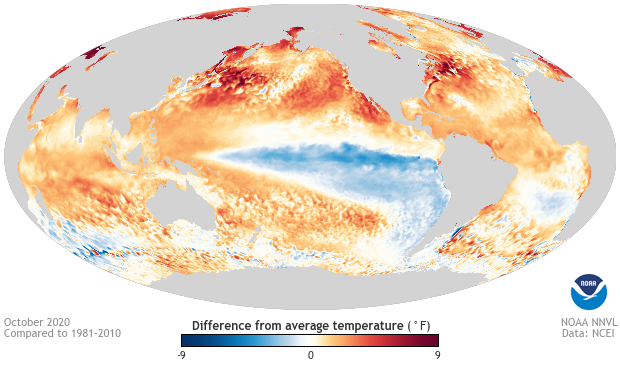
October 2020 sea surface temperature departure from the 1981-2010 average. Lots of cool water at the equator in the Pacific. Image from Data Snapshots on Climate.gov.
Let’s count our chickens
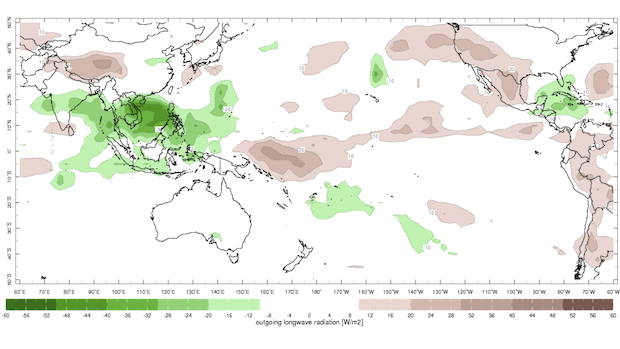
First, we’ll check in with the tropical Pacific ocean-atmosphere system. One of the ways we monitor the atmospheric response to ENSO is through satellite images of the amount of thermal radiation leaving the Earth’s surface. Clouds block this outgoing long-wave radiation, so when the satellites see less outgoing long-wave radiation than average, it means more clouds and rain than average. Conversely, when the satellite picks up more OLR, the skies are clearer than average.
During La Niña, we’d expect to see less rain than average over the central tropical Pacific and more rain over Indonesia—the strengthened Walker circulation, La Niña’s atmospheric response. The OLR map for October 2020 shows this pattern clearly.
Another component of the strengthened Walker circulation is stronger Pacific trade winds, the near-surface winds that blow from east to west near the equator, and stronger west-to-east winds high up in the atmosphere. Both strengthened wind patterns were observed during October, providing more evidence that the ocean-atmosphere coupling we expect during both phases of ENSO is present.
As Michelle discussed just a couple of weeks ago, this coupling is a feedback mechanism that strengthens ENSO. In the case of La Niña, cooler-than-average waters in the tropical Pacific mean the difference between the warm western Pacific and the cooler central Pacific is greater than average. This greater difference leads to the stronger Walker circulation, and the stronger trade winds further cool the surface water in the central Pacific and also pile up warm water in the west. For more details on this feedback, and a whiff of fresh-baked bread, check out Michelle’s post.
Eggs in baskets
Several computer models are suggesting that this La Niña is likely to be a stronger event, with a Niño 3.4 anomaly during November–January cooler than -1.5°C.
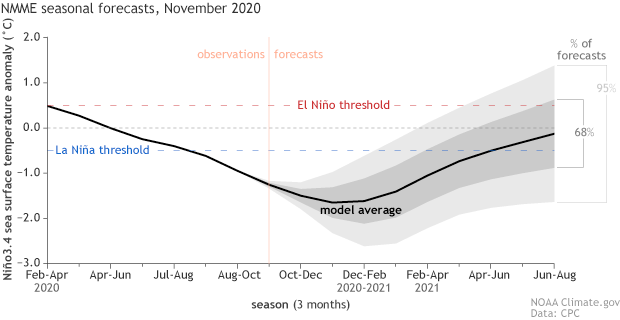
Climate model forecasts for the Niño3.4 Index. Dynamical model data (black line) from the North American Multi-Model Ensemble (NMME): darker gray envelope shows the range of 68% of all model forecasts; lighter gray shows the range of 95% of all model forecasts. NOAA Climate.gov image from University of Miami data.
The substantial atmospheric coupling supports these predictions, as does the amount of cooler water under the surface. These cooler subsurface waters, which are also evidence of the coupled system, will provide a source of cooler-than-average water for the surface over the next few months. October’s average subsurface temperature was the 7th-coolest October since 1979.
The Climate Prediction Center is now providing a probabilistic outlook for the strength of El Niño and La Niña events. Tom described this new technique in a blog post a little while back—it’s too much to get into here, so please check out his post for the details. While forecast probabilities are provided for every season, it is the November–January season that has the largest chance (54%) of Niño-3.4 being below -1.5°C. This would make it a strong event; of the 23 La Niña events since 1950, seven have had maximum Niño 3.4 cooler than -1.5°C.
What came first
As we’ve observed in a few earlier posts about this La Niña, it appears to be relatively rare in our observed record (starting in 1950) for La Niña to develop following a neutral or slightly warm winter like we had in 2019–2020. I got curious about this, so I thought I’d exercise my newfound Python skills a bit and look at the data. (Python is a computer programming language. I’m not a snake wrangler…yet!)
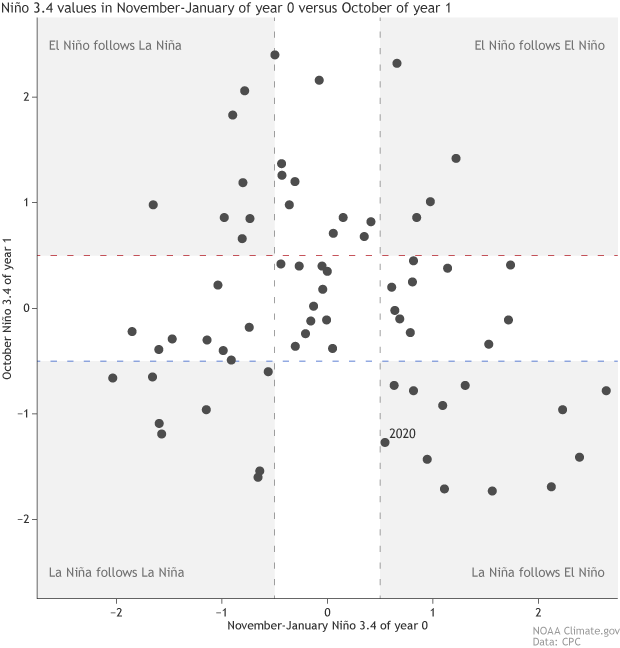
Relationship between the Niño3.4 index in one November–January (vertical axis) with the Niño3.4 the following October (horizontal axis). Figure by climate.gov; data from CPC.
It turns out that the previous La Niña events we’ve observed so far (dots below the blue line) have all been preceded by either El Niño or La Niña. 2020 stands out, following a winter where tropical Pacific sea surface temperatures were slightly warm, but not quite El Niño. Since we only have about 70 years of observations, it’s hard to say exactly how unusual this is—we’d need to do more studies with climate models to find out, but that’s a lot for my monthly ENSO Blog post, to say nothing of my Python skills!
When the conditions come home to roost
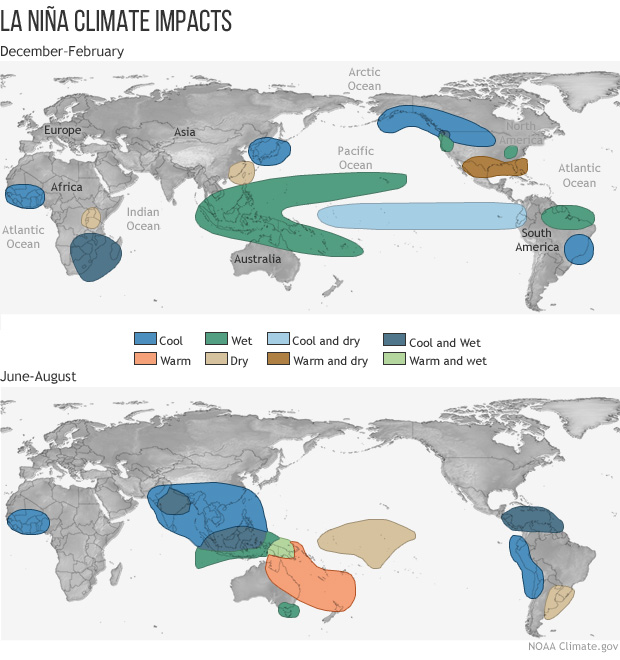
We pay so much attention to ENSO because it affects global weather and climate; a stronger La Niña event means these effects are more likely. We’ve already seen hints of some of the weather and climate patterns we’d expect during La Niña. The most obvious one of these is the extraordinarily active Atlantic hurricane season. La Niña leads to reduced shear (the change in wind from the surface to the upper levels) in the atmosphere over the Atlantic, allowing hurricanes to grow and strengthen.
Although October is a little early for clear La Niña impacts, global precipitation and temperature patterns during the month did give some hints of a La Niña effect, including more rain in Indonesia, drier conditions in southeastern China and the U.S. Southwest, and cooler weather in Canada and into the U.S. Northern Plains. I wrote about potential impacts in more detail last month, so check that out if you missed it.
Nat will cover the winter outlook for North America in his post later this month. And of course, we’ll be here, brooding over La Niña and keeping you up-to-date.
Comments
Cyclone season in south west indian ocean
RE: Cyclone season in south west indian ocean
Hi Sue, I responded to another related comment several weeks ago, and I will paste my relevant response here:
Regarding tropical cyclones, the relationship La Nina and tropical cyclones in the southwest Indian Ocean is a bit challenging to discern. This study suggests that La Nina causes less frequent than normal cyclone occurrences, but this one also suggests that La Nina leads to stronger and longer-lived cyclones in the region. Therefore, the relationship between cyclones and La Nina over the southwest Indian Ocean may be complex and not fully understood.
Impact on India
RE: Impact on India
One of the most important impacts of ENSO on India's climate is on the Indian Monsoon. As Tom discussed in this post, La Nina tends to cause above average Indian summer rainfall, whereas El Nino tends to cause below average rainfall, but there are important details that may affect the strength of this relationship.
If you would like to see global maps of seasonal temperature and precipitation anomalies associated with La Nina or El Nino, then this site can be quite helpful. Also, the India Meteorological Department monitors ENSO and Indian Ocean Dipole conditions, and so this site may be useful.
We're feelin it
Europa
RE: Europa
The impacts of La Nina on Europe are not as strong or as straightforward as the impacts on North America, and there has been considerable scientific debate on this topic. Some studies suggested that northern Europe tends to be warmer than average from mid to late winter during La Nina, and vice versa for El Nino, but there also have been studies suggesting that the impacts of ENSO over Europe are sensitive to details like the strength of the event, the sea surface temperature anomalies in the Atlantic, and more. A key factor for Europe may be whether or not we see a sudden stratospheric warming, as friend of the Blog Dr. Amy Butler wrote about several years ago. Therefore, I recommend keeping eyes on both the tropical Pacific and the air high above in the stratosphere if you're trying to predict impacts over Europe.
Rio Branco, Brazil
RE: Rio Branco, Brazil
It doesn't look like this part of Brazil has a very strong relationship to La Nina, so not sure what to ascribe ongoing drought there to.
Northeastern Mexico (southeast Texas)
RE: Northeastern Mexico (southeast Texas)
Southern Texas often sees a drier and warmer winter when La Nina is ongoing in the tropical Pacific. This is consistent with the CPC outlook for winter:
https://www.cpc.ncep.noaa.gov/products/predictions/long_range/seasonal…
Strong La Nina
RE: Strong La Nina
While the CPC does not characterize events as weak, moderate, or strong, thise in the community that do only look to see one season below a particular threshold. So one 3 month season (which indicates persistent) would be enough.
Strong La Nina ? um no
RE: Strong La Nina ? um no
These are all just model predictions and some models do imply this event may be classified as a strong event. Emily was pointing out the new ENSO strengths tool that's available via the CPC website, and that tool shows a 54% that this event will see seasonal departures exceeding -1.5C. Of course, that also means that there is a 46% chance that it will not.
Golfo de Guayaquil, Ecuador
Add new comment