ENSO as a climate conductor for global crop yields
This is a guest post by Weston Anderson (@HydroClim) who is an assistant research scientist with the Earth System Science Interdisciplinary Center at the University of Maryland and the NASA Goddard Space Flight Center, where he works with the Famine Early Warning System team.
A couple of weeks ago, NOAA issued a La Niña Watch based on the possible development of a La Niña this fall that could persist through Northern Hemisphere winter 2021-22. At times like this, we climate scientists spend a great deal of time discussing how ENSO will affect precipitation and temperature, but we often neglect discussion of what those changes will mean for vegetation and crops. That’s a mistake.
As a scientific community, we’re doing a lackluster job of using what we already know about ENSO (El Niño/Southern Oscillation, the entire El Niño-La Niña system) to monitor and predict global patterns of crop yield surpluses and deficits. If I had to give us a grade, I’d say we get a C+. That may sound harsh, but remember that in the 1980s we already understood many of the ways that ENSO affects the global atmospheric circulation. By the 1990s, we had connected ENSO to crop yields in many parts of the world (see references at the bottom of this post).
And yet, for over 20 years afterwards, despite that meticulous study of how ENSO affects global precipitation, many scientists continued to focus on how ENSO impacts crop yields at regional levels, while ignoring the question of how ENSO impacts crop yield anomalies on global scales. We did this even as strong ENSO events determined the spatial pattern of crop yields on nearly every continent in some years. But it wasn’t until after 2010 that we started to seriously study the question (e.g. Iizumi et al., 2014). We failed to see the forest for the trees.
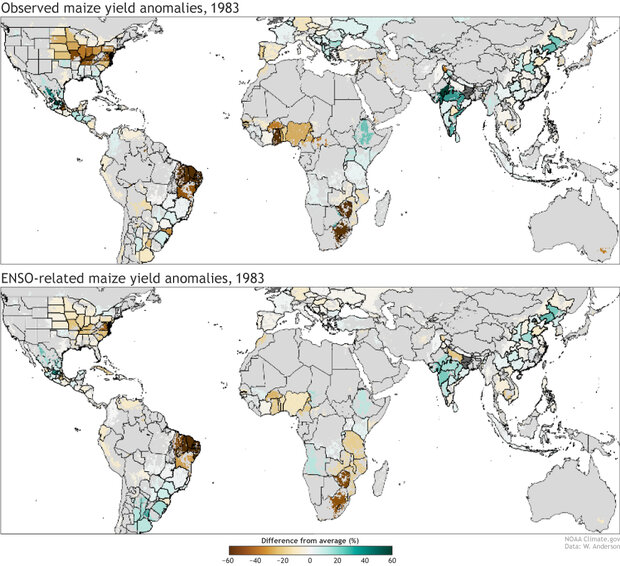
Observed maize yield anomalies (top panel) expressed as percent deviations from the long-term trend for 1983. A very strong El Niño began developing during Mar-May of 1982, peaked during Oct-Feb of 1982-83 and had transitioned into a weak La Niña by the following Aug-Oct of 1983. Estimates of the extent to which ENSO affected maize yield anomalies in 1983 are shown in the bottom panel. Figure adapted from Anderson et al., 2019, which contains the methods used to attribute yield anomalies to ENSO. Figure modified by climate.gov.
Our Food System is Global
Why does it matter if there’s any kind of pattern to global crop yield anomalies in ENSO years? To understand that, we’ll need to take a quick detour to discuss our global food system.
When I say the “global food system,” I’m referring to the fact that roughly a quarter of all calories consumed by humans are traded internationally today. This is a marked increase from 30-40 years ago, prior to widespread agricultural trade liberalization. While more people have access to an adequate number of calories today than ever before, people are increasingly reliant on global trade for that access (1).
Relying on internationally traded food is not necessarily a bad thing, it’s simply a different food system than one in which you rely on food produced entirely in your immediate region. One benefit of a global food system is that by geographically distributing crop production, your access to a crop isn’t necessarily wiped out by any single drought. For example, one country may depend on another country, like Australia, to provide them enough wheat. If Australia doesn’t produce enough wheat due to a poor harvest, then that country can get their wheat from somewhere else, like Argentina. However, this stability assumes that major wheat producing countries like Australia and Argentina won’t simultaneously have poor harvests.
Perhaps it’s a good time to focus on that forest again.
ENSO is a control freak
The assumed independence of crop yields in distant breadbasket regions can break down during ENSO events. As I mentioned before, we know that ENSO organizes precipitation, temperature, and cloud cover on global scales in many seasons, so it’s only logical that it likewise affects crop yields (2). And by influencing the growing season climate to be more or less favorable, ENSO is picking agricultural winners and losers.
So how widespread is the influence of ENSO? After all, many crops are grown in Northern Hemisphere summer, when ENSO tends to have weaker amplitude and a weaker influence on the global climate. Well, for better or worse, ENSO is estimated to affect yields on over a quarter of global croplands. And while it doesn’t affect crop yields every year, it can have an outsized influence in certain years when ENSO is particularly prominent relative to other weather and climate patterns (3). The massive El Niño of 1982–83 that subsequently swung into a La Niña, for example, had a tremendous influence on global maize yields. It was responsible for affecting the maize yields on nearly every continent that year.
But when I say ENSO is a control freak, I don’t just mean that it organizes the spatial pattern of global crop yields. It can also tie good or bad years together across time.
La Niñas bring a friend
One feature of ENSO that’s particularly relevant to agriculture is that La Niñas often come in pairs and occur back to back, like those terrifying twins from The Shining. The avid reader of the ENSO Blog may already know this, given that last year was a La Niña year, and here we are again in a La Niña Watch. And, unfortunately, just like those nightmarish ghoul-girls, more isn’t always better in regions where La Niña tends to cause drought. In areas like the southern US, Horn of Africa and southeast South America, multiple La Niñas may mean consecutive years of poor crop yields (4). In these regions, multi-year droughts can deplete water reservoirs used for agriculture and could draw down grain reserves two years in a row. In southeast South America, for example, there is good evidence that multiple La Niñas often mean consecutive years of below expected yields (Anderson et al., 2017). So, these regions may understandably want to prepare for the possibility of a second consecutive year of poor yields given the current La Niña Watch.
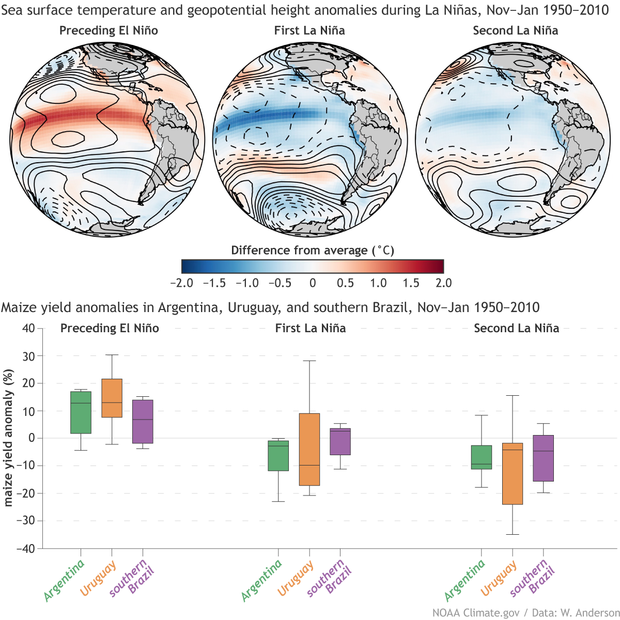
Average observed sea surface temperature and geopotential height anomalies for Nov-Jan during La Niñas, which tend to be preceded by El Niños and followed by weaker La Niña-like conditions, for the years 1950-2010 (top panel). Corresponding maize yield anomalies, expressed as percent deviations from the long-term trend, in Argentina, Uruguay, and Southern Brazil (Paraná, Santa Catarina, and Rio Grande do Sul). Figure provided by Weston Anderson and modified by climate.gov.
Aside from worry, what should we do?
Going forward, the climate science community would do well to strengthen working relationships with the food systems and food security community. And I’m not just talking about agronomists. We need to be working with those that study pastoralists, aquaculture, and global trade as well (among others). By doing so, we can make good use of the truly remarkable knowledge amassed by the climate science community with respect to the way that ENSO organizes global climate, and, therefore, presents a structured risk to the global food system.
Lead Editor: Michelle L’Heureux (NOAA CPC)
Footnotes
(1) This can be a problem when the cost of globally traded crops spikes, making food unaffordable for many of the world’s most food insecure as a result of events happening thousands of miles away. This occurred during the global food price crisis of 2008 and again in 2011.
(2) Granted, the relationship between the climate and crop yields is not always straightforward; but the fundamental ways that ENSO affects crop yields is no different from how it affects, say, precipitation. For example, wheat yields in Australia are related to those in southeast South America due to the basin-wide atmospheric circulation response to tropical convection forced by ENSO in the South Pacific during southern hemisphere spring, which is the wheat growing season in both regions. Australia is on the western edge of the circulation response, while southeast South America is on the eastern edge, affected by the Rossby Wave response known as the Pacific-South American pattern (a southern hemisphere counterpart to the Pacific-North American pattern that Michelle previously discussed; see also Anderson et al., 2018). Likewise, crop yields in southeast South America and North America are related to one another because when ENSO affects convection in the tropical Pacific, it forces Rossby Waves to propagate into the midlatitudes of both hemispheres, which affects precipitation over major wheat and maize growing regions in both North and South America. Although the growing seasons are offset in the Americas, ENSO forces an atmospheric response that affects South America during the peak of the ENSO event (Southern Hemisphere summer), while North American growing seasons are affected by either a developing or decaying ENSO event (Anderson et al., 2017; Anderson et al., 2018)
(3) ENSO is estimated to affect crop yields on ~28% of global croplands (Heino et al. 2018). This really highlights how widespread the spatial footprint of ENSO is despite the fact that it is strongest during the winter in the northern hemisphere. When we measure the influence of ENSO on the year-to-year variability of global crop production, it accounts for only about 18%, 7%, and 6% of global year-to-year yield variability for maize, wheat, and soybeans, respectively (Anderson et al., 2019). In individual regions, however, the influence of ENSO on the year-to-year variability of crop yields is much larger. In southeastern Africa, for example, ENSO accounts for over a quarter of all year-to-year variability in maize yields (Anderson et al., 2019).
(4) For those keeping score, the crops grown during Southern Hemisphere summer in each of the aforementioned regions did experience poor growing conditions that reduced expected crop yields during the peak of last year’s La Niña (2020-21).
References
Handler, P. and Handler, E., 1983. Climatic anomalies in the tropical Pacific Ocean and corn yields in the United States. Science, 220(4602), pp.1155-1156.
Cane, M.A., Eshel, G. and Buckland, R.W., 1994. Forecasting Zimbabwean maize yield using eastern equatorial Pacific sea surface temperature. Nature, 370(6486), pp.204-205.
Mauget, S.A. and Upchurch, D.R., 1999. El Niño and La Niña related climate and agricultural impacts over the Great Plains and Midwest. Journal of production agriculture, 12(2), pp.203-215.
Podestá, G.P., Messina, C.D., Grondona, M.O. and Magrin, G.O., 1999. Associations between grain crop yields in central-eastern Argentina and El Niño–Southern Oscillation. Journal of Applied Meteorology and Climatology, 38(10), pp.1488-1498.
D'Odorico, P., Carr, J.A., Laio, F., Ridolfi, L. and Vandoni, S., 2014. Feeding humanity through global food trade. Earth's Future, 2(9), pp.458-469.
Porkka, M., Kummu, M., Siebert, S. and Varis, O., 2013. From food insufficiency towards trade dependency: a historical analysis of global food availability. PloS one, 8(12), p.e82714.
Heino, M., Puma, M.J., Ward, P.J., Gerten, D., Heck, V., Siebert, S. and Kummu, M., 2018. Two-thirds of global cropland area impacted by climate oscillations. Nature communications, 9(1), pp.1-10.
Iizumi, T., Luo, J.J., Challinor, A.J., Sakurai, G., Yokozawa, M., Sakuma, H., Brown, M.E. and Yamagata, T., 2014. Impacts of El Niño Southern Oscillation on the global yields of major crops. Nature communications, 5(1), pp.1-7.
Anderson, W.B., Seager, R., Baethgen, W., Cane, M. and You, L., 2019. Synchronous crop failures and climate-forced production variability. Science advances, 5(7), p.eaaw1976.
Anderson, W., Seager, R., Baethgen, W. and Cane, M., 2017. Crop production variability in North and South America forced by life-cycles of the El Niño Southern Oscillation. Agricultural and Forest Meteorology, 239, pp.151-165.
Anderson, W., Seager, R., Baethgen, W. and Cane, M., 2018. Trans-Pacific ENSO teleconnections pose a correlated risk to agriculture. Agricultural and forest meteorology, 262, pp.298-309.
Comments
Agriculture
Providing an early projection for crop yields based on forecasted global weather patterns for the coming season seems commendable; however current agricultural practices taking place globally will ultimately determine crop yields. Some readers of this blog may not be aware of the agricultural dilemmas our planet currently faces. The following are a few of the agricultural issues that need to be addressed:
> The alarming rate of top soil loss, globally.
> The loss of C in agricultural soils.
> Higher temperatures generally lead to lower crop yields, especially C3 species such as rice. Attempts to genetically modify rice to a C4 species does not address the major issues that need to be overcome.
> The current global food system is responsible for 19% to 29% of all global CO2 emissions.
> The agricultural use of artificially fixed N and its subsequent release into the environment is having global consequences that are too long to list here; however, the release of N2O (a potent GHG) and NH3 into the environment are two noteworthy examples.
> Current P fertilizer usage is unsustainable: It is now necessary to exploit lower grade ores which can be mildly radioactive, and contain toxic concentrations of As and Cd. This is an issue if you grow and/or eat rice.
> It is my understanding that throughout Asia, Central and South America, and much of Africa there are large numbers of subsistence farmers that receive very little appropriate technical support. These farmers comprise a large portion of the regional agricultural system, providing regional food security.
live crop moisture level
Interesting. Since ENSO changes global air circulation and it has an affect on local/regional average air temperatures etc. it obviously effects live vegetation moisture. Have you ever tried measuring reservoir and aquifer water table levels before and after La Ninas(Las Ninas)? I know there was once a satellite used for something similar.... and the San Juaquin Valley here in California, for example, is over pumped regardless but it would be interesting to overlay such studies to your cop map.
Comments have been disabled on this article