July 2021 ENSO update: La Niña Watch
As things stand with the El Niño-Southern Oscillation (ENSO), neutral conditions are currently present in the tropical Pacific and favored to last through the North American summer and into the fall. But forecasters at NOAA’s Climate Prediction Center have issued a La Niña Watch, which means they see La Niña likely emerging (~55%) during the September-November period and lasting through winter.
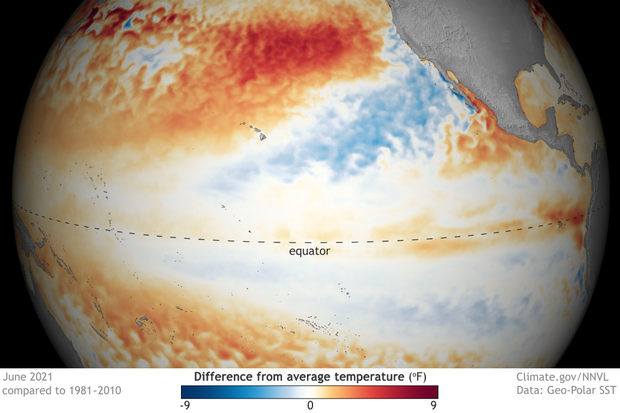
June 2021 sea surface temperature departure from the 1991-2020 average. Image from Data Snapshots on Climate.gov.
Where we are:
I know you’re all excited for me to talk about La Niña, but I’m a killjoy, so bear with me for a second while I talk about the current state of the Pacific. In June, ocean surface temperatures were near the 1991-2020 average across the equatorial Pacific, including the all-important Nino3.4 region (check out this post for more on ENSO indices), which we use to monitor the state of ENSO. Specifically, the June sea surface temperature in the Nino3.4 region was 0.25 degrees Celsius below average, well within the ENSO-neutral range. Ocean temperatures in this region have been quickly returning to near-average conditions over the last several months, increasing by nearly half a degree Celsius since April and over a degree Celsius since last winter’s La Niña peak.
But as we have said, so many, many times: there is more to ENSO than just the surface of the ocean. Putting on our snorkels, let’s dive beneath the surface of the Pacific, where things aren’t as near average but still firmly indicative of an ENSO stuck in neutral. Waters were slightly warmer than average, except for the eastern Pacific where cooler-than-average waters developed near the thermocline—the layer of water that marks the transition between the warmer upper ocean and colder deeper ocean. But overall, nothing to write home about.
To finish off this trilogy of signs about our current ENSO-neutral Pacific, we look to the skies! After all, ENSO is a coupled atmosphere/ocean climate phenomenon. And for the past month, that atmosphere has been pretty darn neutral. Winds at both low and high levels of the atmosphere were pretty normal, and while thunderstorm activity was reduced near the dateline, things were mostly average elsewhere.
There hasn’t been a more boring trilogy since Star Wars episodes 1-3 (yeah…I said it). But then again, that’s expected during neutral ENSO conditions across the Pacific.
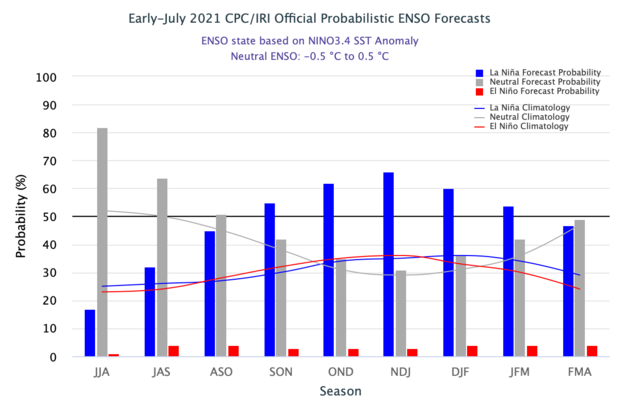
The official CPC/IRI ENSO probability forecast, based on a consensus of CPC and IRI forecasters. It is updated during the first half of the month, in association with the official CPC/IRI ENSO Diagnostic Discussion. It is based on observational and predictive information from early in the month and from the previous month. Image from IRI.
Where we’re going:
It might seem odd, then, with things seeming so… blah… that a La Niña Watch has been issued. To clarify, a La Niña Watch means conditions are favorable for the development of La Niña within the next six months. So, what’s in the climate model “tea leaves” that has helped scientists feel comfortable enough to start throwing the La Niña label around?
The answer, in part, lies in a strong computer model consensus. While most of the models we look at predict ENSO-neutral to continue to last through fall, many models from the North American Multi-Model Ensemble (NMME) favor a transition to La Niña during the fall and into winter. The NMME is incredibly helpful to forecasters in predicting the future state of ENSO, especially when we are past the notorious spring barrier, a time when model accuracy wanes.
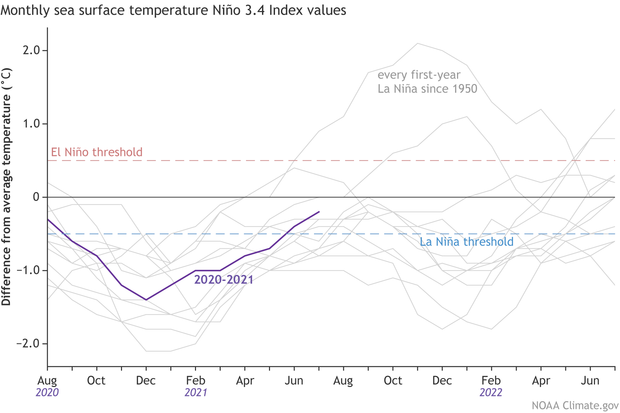
Monthly sea surface temperature anomalies (difference from average) in the Niño 3.4 region of the tropical Pacific for 2020-21 (purple line) and all other years starting from first-year La Niña winters since 1950. Climate.gov graph based on ERSSTv5 temperature data.
Where’s the beef?
Is it all that unusual to have two La Niña winters back-to-back? Nope! In fact, of the twelve first-year La Niña events, eight (!) were followed by La Niña the next winter, two by neutral, and two by El Niño. Honestly, with those numbers, it would have been more surprising if we thought neutral conditions would continue all year.
Putting all of those 12 first-year La Niñas together with 2020-2021, it’s evident how much this last year doesn’t stand out. Though, twelve past cases are not a ton to rely on by itself. This La Niña Watch is buoyed by much more than that.
One specific reason why and when any change to ENSO is important is the potential influence on the Atlantic and eastern Pacific hurricane season. As noted on the ENSO Blog in the past, La Niña can help make atmospheric conditions more conducive for tropical cyclones to form the Atlantic, and less conducive in the Eastern Pacific. If 2021 so far is any indicator, it could be an active year: through the beginning of July, five named storms in the Atlantic have already formed, a new record—breaking the previous record set just last year. In August, the Climate Prediction Center will issue an updated hurricane outlook, so stay tuned for more info on that. In the meantime, you can read the outlook from May to see what scientists were thinking two months ago.
Comments
Ugh-La Nina
Originally submitted by Dan, on
Boy, we sure hope that if it does turn out to be a La Nina year , it is an anomaly and we can get at least close to normal rainfall in Southern and Central California. If not, there are rivers in the foothills of the Sierras (i.e. the Kaweah) that would conceivably go dry, which has never happened before. All it takes it a couple of major storms...here's hoping.
RE: Ugh-La Nina
....and northern California. We need rain, and snow, all up and down our Sierras. Klamath River is dying, too
RE: RE: Ugh-La Nina
Sometimes we have wetter conditions during La Nina winters in California, so dry conditions aren't set in stone. ENSO is important as a prediction tool for California, but it is not the entire ballgame. Here's an example of one memorable wet La Nina winter:
https://www.climate.gov/news-features/blogs/enso/why-did-it-rain-so-much-california-during-last-year’s-la-niña
CPC's seasonal outlooks are in terms of probabilities (percent chance that something will happen) and it's never anywhere close to 100%. La Nina offers a hedge in the direction of certain future outcomes, but not a guarantee. Check out NOAA CPC's seasonal outlook which is updated on the 3rd Thursday of each month here (click the links that say X-month outlook): https://www.cpc.ncep.noaa.gov/products/predictions/long_range/
RE: RE: RE: Ugh-La Nina
Weren't the recent La Nina wet years FY2010-2011 & FY2016/2017 La Nina Modoki years?
RE: RE: Ugh-La Nina
I believe the La Niña prediction would cause above average rainfall to the northern pac west, NorCal and up would get rain, the drier and warmer temps would affect southern cal to the north east of the us. I am very much hoping so cal does not get stuck in a warmer fall and winter with heightened fire risk. We are beyond ready for the heat to pass.
RE: RE: Ugh-La Nina
Thanks to the govt, it is illegal to catch rain water... so there is that!
Not illegal
<edited--RL.> It’s not illegal.
Government has been wrong about a lot of things
Catching rainwater is a necessity and a god-given right protect yourselves and greywater is a wonderful way to keep up on watering food and Gardens I know you
RE: Ugh-La Nina
Nina/Nino, whatever it may be, they don't always pan out to what they're supposed to do. There have been times we were going to have a very wet winter and didn't. I have always asked but still don't know where to go to the proper people, why haven't we built more Dams? I am sure there are many locations where we can catch water and save or distribute it more evenly to proper locations throughout California. With all the political big brains and technology we have surely someone should be able to come up with a brainstorm in collecting and saving water. Governor, Mayors, County, and city managers get your heads together and figure something out that won't hurt the public. Save water by not building more structures, buildings, houses, parking lots.
RE: RE: Ugh-La Nina
Billions of water could be saved with better forestry’s management. Most every tree uses 10 gallons of water everyday per inch of diameter measured at about 5 feet. 15 inch tree equals 150 gallons gone every day, Plus, you stop having forest fires.
RE: RE: RE: Ugh-La Nina
Well yes, no forest fires without forests. Faster-moving brush fires instead. But tree roots hold moisture so rain doesn't just run off and take topsoil with it. In deforested areas, replanting often mediates run-off and works to refill lakes, rivers, groundwater reserves.
RE: Ugh-La Nina
submitted by Ed on
I hope the west gets rain. Just because it’s a La Niña doesn’t mean the forecast is set in stone. Last year ,2020 was La Niña and SC was 12 inches above normal precipitation . Anywhere you look it will say in La Niña years the southeast will be dry. Glad to see they still haven’t been able to nail it down.
Here we go
Well looks like you got your wish! :) :) :)
RE: RE: RE: RE: Ugh-La Nina
Flavors like Modoki are actually represented by a continuum that also scales by intensity. In other words, looking a the strength of Nino-3.4/ONI is a good proxy for the flavor (and vice versa). However, the SST anomaly patterns for El Nino events tend to be more distinctive than for La Nina events which look more similar to each other. It is especially not clear that La Nina events should be classified by flavor. In my opinion, it’s more instructive to just examine the intensity of ENSO events as measured by a variety of indices. This also makes better sense from an prediction perspective because it’s often the strength of the signal that scales with impacts (signal-to-noise is a measure of predictability).
RE: RE: RE: RE: RE: Ugh-La Nina
Thank you Michelle for that explanation
ENSO coupling mechanism?
"coupled atmosphere/ocean climate phenomenon"
By atmosphere, do you mean lunar? It's becoming clear that ENSO is riven by a lunar forcing coupled to a strong annual signal, see
https://www.nature.com/articles/s41598-019-49678-w
Lin, J., Qian, T. "Switch Between El Nino and La Nina is Caused by Subsurface Ocean Waves Likely Driven by Lunar Tidal Forcing". Sci Rep 9, 13106 (2019).
Should be able to do better predictions with this knowledge.
RE: ENSO coupling mechanism?
I agree, they need to pay attention to this article. In addition to this reply I have posted another blog comment below. I sure hope this gets their attention and someone is including this model in future models of ENSO.
Seeking clarity.
Submitted by Aaron Shunk on
You say "of the twelve first-year La Niña events, eight (!) were followed by La Niña the next winter, two by neutral, and two by El Niño."
Can you provide the years for these events? I am struggling to understand the 12 first year Lan Nona means.
Cheers. Aaron
RE: Seeking clarity.
We came up with this statistic using our historical chart of El Niño (warm phase) and La Niña (cold phase) events here:
www.cpc.ncep.noaa.gov/products/analysis_monitoring/ensostuff/ONI_v5.php
A "first year" La Nina means that there was no La Nina prior to its start. A "second year" La Nina means that there was a La Nina winter (events tend to reach their strongest point in the winter months) prior to the second winter of La Nina. So by that count, here's the first year La Nina winters that were followed by La Nina the next winter ( 8 events total ):
1954-55 followed by 1955-56
1970-71 followed by 1971-72
1973-74 followed by 1974-75
1983-84 followed by 1984-85
1998-99 followed by 1999-2000
2007-08 followed by 2008-09
2010-11 followed by 2011-12
2016-17 followed by 2017-18
Pacific Warm Spot
Looks like "the blob" may be forming again in the NW pacific. Could this be the cause of the recent heat waves on the west coast? How does the marine heat wave impact ENSO?
RE: Pacific Warm Spot
Emily discussed the blob in her last blog post (toward the bottom), which contains some useful links which you can click to get the latest info:
https://www.climate.gov/news-features/blogs/enso/june-2021-enso-update-neutral-noodle
Also, we discussed blob-ENSO linkages as part of a blog panel here (still relevant):
https://www.climate.gov/news-features/blogs/enso/seeing-red-across-north-pacific-ocean
La Niña
Seems It’s simply a continuation of the present LN with perhaps a brief passage through neutral conditions
RE: La Niña
We're officially in ENSO neutral right now and anticipate to continue in this state until the Fall. It isn't until September-November season that we anticipate a ~55% chance of La Nina returning. Nat had a nice article on multi-year La Nina and why they occur recently so check it out:
https://www.climate.gov/news-features/blogs/enso/double-dipping-why-does-la-niña-often-occur-consecutive-winters
La Nina
Another dry year for California would be a disaster. Wish ENSO would produce a La Nina Modoki like FY10/11 and FY16/17. Those were wet years
El Niño por favor.
What’s up with the La Niña cheerleading? Those of us in central Texas would favor the moisture and cold winter that come with El Niño.
RE: El Niño por favor.
Kip, I don't think there is much cheerleading here. We feel your pain here in California. The FY17/18 and FY20/21 La Nina's were bad for California. I would rather take my chances on El Nino
RE: RE: El Niño por favor.
Yup, 2020 la nina all the way to Mendocino County Ca sucked. Half the rain of an already reduced rainfall. The storms went to Humboldt and then veered east. Depressing.
RE: El Niño por favor.
As far as I can see NOBODY likes the da**n thing, all it does is bring heat and drought to the west.
Thank you.
Nice post author. Thank you.
How will affect La Niña in the central coast o Peru?
I am a follower in Facebook, I am peruvian, can you tell how will it be around here?
Reemergence of La Nina and New Mexico
Hello: La Nina generally means below normal for NM, which is already absolutely parched. Here in Santa Fe, even with ENSO neutral conditions, the 2021 summer monsoon is basically once again (third year in a row) a nonsoon. NWS in Albuquerque keeps predicting high percentages of heavy rain for Santa Fe, but all the rain is going to the east and southeast of us or to AZ. El Nino is the event that usually brings rain and snow our way. Looks like no hope again for 2021-2022. Any thoughts whether an El Nino may emerge 2022-2023 based on historic data or are we permanently done in by man made climate change? Thanks.
RE: Reemergence of La Nina and New Mexico
Right now, 2022–23 is too far away to predict using climate models. There are three periods of three-year La Niña in the historical record, but also three periods where El Niño followed two-year La Niña, so there is no overwhelming historical prediction, either. Finally, most scientists think that El Niño will continue to occur despite global warming, but it's a complicated subject, as Tom discussed.
RE: Reemergence of La Nina and New Mexico
There is no reliable way to determine what will happen winter FY22/23 yet. Too far away. We will start to get a hint during late winter and early Spring but confidence is low until we are passed the Spring Predictibility Barrier around next June/July. During spring FY13/14, models were pointing to a strong El Nino for FY14/15 but it never materialized. Too early for accurate forecast
Good post
It’s amazing that 2016/17 and 2018 season of over 50 feet of snow at donner summit and still not enough water demands for southern ca. You know Northern ca has water restrictions. My sister lives in upland, most of her neighbors have never heard of a water restriction.
RE: Good post
We don't get our water from Tahoe. And we are way more efficient down here already than you guys up north.
Lunar forcing of ENSO
The ENSO team has done a great job of modeling behavior of El Nino and La Nina, but have yet to have a predictive model that works in the spring. Even for the rest of the year the model is not as accurate as it could be.
In the ENSO blog I found a reference to an article(1) from 2019 about the forcing function of the moon tidal effect.
I happen to have been reading up on the prediction of eclipses which is extremely accurate, and so have interest in the orbit of the moon. The effect of the moon on tides is well understood and tides can be predicted with great accuracy. So far I have not seen any indication that your team is taking advantage of this information about the subsurface ocean wave in enhancing your prediction of ENSO.
I believe that your team is very busy and may have missed this comment on your blog. Thus I wanted to bring it back to your attention as I find this paper to be very compelling. Please read this paper and perhaps contact the authors for more collaboration. Feel free to contact me too. I would be interested in any discussion that ensues.
1.Switch Between El Nino and La
Nina is Caused by Subsurface Ocean Waves Likely Driven by Lunar Tidal Forcing.
Jialin Lin & TaotaoQian
www.nature.com/scientificreports s41598-019-49678-w.pdf
El Nina and Texas winter
Will this weather event cause the same winter conditions Texas saw last year? We had 24 inches of snow and days on end of below freezing temps.
RE: El Nina and Texas winter
The conditions experienced in Texas last winter, particularly last February, were very unusual, especially for a La Nina winter. Therefore, even if we have another La Nina next winter, we can say it is highly unlikely (though not impossible) that Texas will experience the sort of extreme weather they experienced last winter.
Come on El Niño!
I live about 15 minutes east of Cleveland, 1 mile from the Lake Erie shoreline. I am tired of snow bands sitting over my house. Per usual, I will be praying to the sun gods for a strong El Niño in 2021-2022.
After reading this update, it doesn't look promising...but a girl can hope.
El Niño/Nina question
Can there be something like this happening by the cape cod Massachusetts ? We are on the eastern Atlantic seaboard and i personally live a little higher then the cape but noticed it was unusually warm and I’m just worried about sharks . I have Sharktivity but they’re all pinging down cape and I know that the nino/Nina weather makes a difference ! Thanks for any answers just trying to learn all I can since witnessing an attack in 2018 ! Instead of being scared of the ocean I’m learning about it !
RE: El Niño/Nina question
It's more likely that the trends off the coast of cape cod are some combination of climate change and variablity in the Atlantic Merdional Overturning circulation. Some of this was touched upon in this NOAA study:
https://psl.noaa.gov/news/2015/102915.html
La Nina
Thanks to the author for the informative post. I will continue to check back for updates. Especially interested in what this means for snow pack in Oregon. All of us want more precipitation and La Nina does it for us; See 2016-17 for around 700 inches on Mt Bachelor.
RE: La Nina
We have a past article on La Nina and snow ... keep in mind this is the average of all events and there is enough variability that it may very well not turn out like the map suggests (everything is probabilities.. "a chance of"):
https://www.climate.gov/news-features/blogs/enso/what-about-snow-during-la-niña-winters
Hurricane Kathleen during 1970's Drought
26-08-2021 11:50 HRS .
Life-long ( 51 years of age ) resident of southern California here . I must go on record as stating that 1997 was my favourite year for weather in this region -- NO garbage Santa Ana Wind that year at all ! Ocean surface temperatures were around 75 degrees to 77 degrees , which drew-in tonnes of tropical weather ; a pure joy .
Ne'er-the-less : I recall the 'drought' in the mid-70's ( c.1974 - c.1978 ) as I was constantly admonished for taking too long of a shower ( "But , it was raining in Ohio and Pennsylvania , mom !" ) .
During this vapid duration , a true anomaly struck the Imperial Valley region : Hurricane Kathleen-come-Tropical Depression hit on 7th Sept and dissipated on 11th Sept . , leaving destruction in its path .
I recognise that the Ocean Surface Temperatures are 68 degrees in San Diego , and 71 degrees in San Clemente -- is that much of a variation considered normal ?
Signed -
Despise Santa Ana Wind .
Thank you.
Thank you author. Your post is so helpful. Please keep it up.
Comments have been disabled on this article