October 2021 ENSO update: La Niña is here!
Our second-year La Niña has materialized, as indicated by the ocean and atmosphere in the tropical Pacific. There’s an 87% chance of La Niña this winter, the season when North American weather and climate are most affected by ENSO (El Niño/Southern Oscillation, the entire El Niño/La Niña system).
The winning numbers
The first step on our “Is it La Niña?” decision tree asks “is the monthly Niño-3.4 Index equal to or less than -0.5°C?” The Niño-3.4 Index, our primary metric for ENSO, is the anomaly in sea surface temperature in the central equatorial Pacific (anomaly = the difference from the long-term average; “average” is 1991–2020 nowadays).
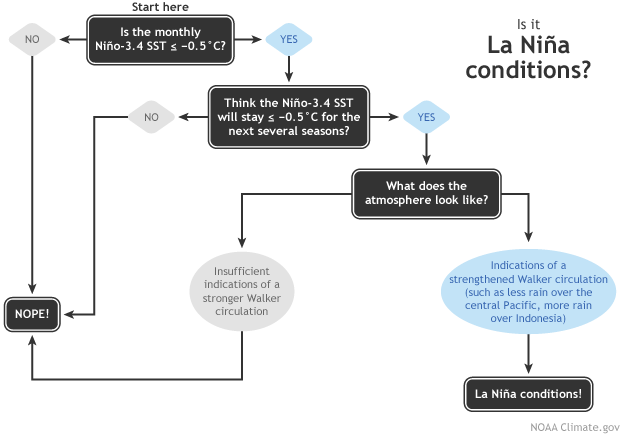
Flowchart showing decision process for determining La Niña conditions. Figure by Fiona Martin, adapted by Climate.gov.
The September Niño-3.4 Index was -0.5°C, according to ERSSTv5, our primary dataset. So it’s on to the next box on the decision tree! Do we think that anomaly will remain cooler than the La Niña threshold? Again, yes! Nearly all computer models are currently predicting that the cooler-than-average conditions will remain through the winter. Another source of confidence for the Niño-3.4 Index to remain cooler than the La Niña threshold is the large amount of cooler-than-average water beneath the surface of the equatorial Pacific. This subsurface water provides a source for the surface, and it has been intensifying in recent weeks.
Water temperatures in the top 700 meters (2,300 feet) of the tropical Pacific Ocean compared to the 1991-2020 average in late summer 2021. NOAA Climate.gov animation, based on data from NOAA's Climate Prediction Center.
The final requirement to get to La Niña conditions is that the atmosphere is showing signs of responding to that cooler-than-average surface water. Over the past month, the low-level winds near the equator, which usually blow from east to west (the trade winds), were stronger than average, as were the west-to-east winds high up in the atmosphere.
These signs, along with more rain than average over Indonesia and less in the central Pacific, tell us that the Walker circulation is juiced up. A stronger Walker circulation is the expected atmospheric response to La Niña. The Walker circulation is driven by the difference between the very warm ocean surface in the far western Pacific and the relatively cool eastern Pacific; during La Niña, this difference is enhanced, leading to a stronger Walker circulation.
Follow the blue brick road, and we get to La Niña!
Buy one, get one free
La Niña has probably earned silver-elite, frequent-flier status here, as this is the fourth time we’ve written a “La Niña is here” post on the ENSO Blog! (Earlier posts are September 2020, November 2017, and November 2016.) That’s four of the seven-and-a-half years we’ve been standing on this digital street corner yelling about ENSO.
Overall, La Niña is not more common that El Niño—in the historical record dating back to 1950, there have been 25 El Niños and 24 La Niñas (counting this year). However, La Niña often occurs in consecutive winters, while El Niño rarely does. The reason for this is difficult to explain in brief, but researchers think it’s partly due to differences in atmosphere-ocean coupling between La Niña and El Niño.
As you can see int he map below, the center of the ocean surface temperature anomaly tends to be a bit weaker and a bit farther west during La Niña than El Niño. The difference in strength and location means the trade winds response is not exactly opposite in La Niña and El Niño—unsurprisingly, the response tends to be weaker and centered farther west during La Niña than El Niño.
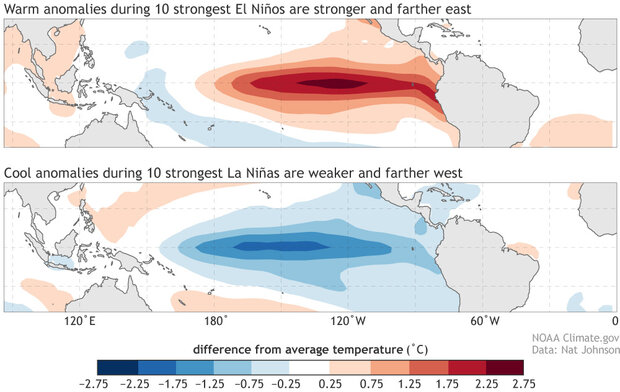
Average November – January sea surface temperature anomalies (°C) for the top 10 strongest (top) El Niño and (bottom) La Niña events since 1950 based on the November – January Niño3.4 index. Anomalies are calculated with respect to 30-year base periods updated every 5 years (see here for a description). NOAA Climate.gov figure with ERSSTv5 data obtained from the NOAA Physical Sciences Laboratory.
El Niño events end when the equatorial temperature anomalies are dispersed away from the equator, and this process tends to be less robust in La Niña. The less-clean end to La Niña means that it’s not hard for the system to tip back into La Niña the next year. For more on how this works, check out Nat’s excellent post on double-dip La Niña.
Holiday sale
We’ve already seen one likely effect of La Niña this year—a more active Atlantic hurricane season, with nearly twice as many storms as average so far this year. But the most substantial La Niña effect on North American rain, snow, and temperature happens during winter. In summary, La Niña winters tend to be drier and warmer across the southern third of the U.S., and cooler in the northern U.S. and Canada. The Pacific Northwest, the Tennessee/Ohio Valleys, and parts of the Midwest tend to see more rain and snow than average.
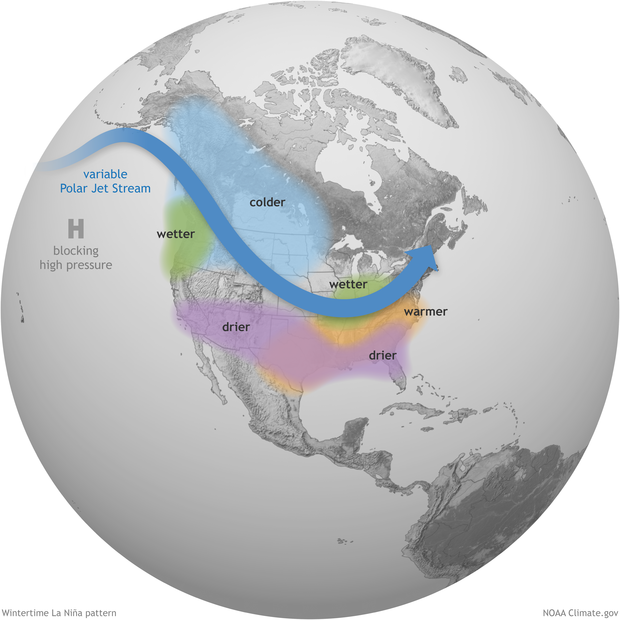
La Niña intensifies the average atmospheric circulation—surface and high-altitude winds, rainfall, pressure patterns—in the tropical Pacific. Over the contiguous United States, the average location of the jet stream shifts northward. The southern tier of the country is often drier and warmer than average. NOAA Climate.gov illustration.
For more information, check out these posts on how La Niña affects the Jet Stream, drought during second-year La Niña, snow during La Niña winters, and La Niña’s role in South American climate. NOAA’s Climate Prediction Center’s winter weather outlook will be released soon, and you can find the current seasonal forecasts here.
And, of course, we’ll be here at the ENSO Blog to keep you updated as La Niña 2021–22 progresses. Till next time!
Comments
comment
still just mostly a guess. too funny.
Your point?
What's your point, aside from being needlessly condescending? No one's forcing you to accept their analysis and forecast. No one's forcing you to somehow abide by it, to live your life according to it. So why bother commenting? Take it or leave it. Actually, better yet, suppose you enlighten all of us with YOUR (presumably superior) analysis and forecast? Maybe we could have a contest, whereafter I'll make a donation to your favorite charity should your forecast prove superior after an impartial, third-party, post-season analysis.
Your point
Nice!
La Niña
fantastic basic overview here, of circulation- effects/ deciphering- @ la- Nina impacts.. and possibly ramifications 🤘🤘👍
Costa rica
What could this pattern mean for the central Pacific coast of Costa Rica Nov 11-14th?
Quepos, Costa Rica
Having taken many trips to Costa Rica during different times of the year as well as under different ENSO events. I would venture to state that the region from Quepos south to about Drake Bay will experience a drier and warmer weather pattern. I would expect to to begin in late October 2021 and last to about June 2022.
La-palma plumes
Thanks for the updates, Emiley!
I have two questions please:
Firstly, What are the odds of strong lanina manifestation in the next 4 months ?
Second question: Will the La-palma volcanic plumes have any susbtantial impact on the 3.4 monthly estimates, or in other words does it have substantive impacts to account for and if any what are the possible consequence. I realize volcanic forcing can have different manifestations regionally and internationally but the pictures from the Island over the last 4 weeks are indicative of some impact here and there .
Many thanks again for your informative update.
BR
Mohammad Alkhateeb .
The Hashemite Kingdom of Jordan
W. Africa response
While I can't speak to this specifically, I do track the weather of the western Sahel. Typically the rainy season doesn't arrive until the E Atlantic waters reach 29C. Therefore the regional cooling may make for a drier 2022 season. Great question though..... I look forward to NOAAs response.
Second year La Nina
Lol, please excuse us if we are not jumping for joy in California. Three out of the last four La Ninas. and the last three have resulted in below normal rainfall and last year's winter can only be described as a disaster. We are at the breaking point and I fear what is in store for us if we have another year like last year. The seasonal NMME precipitation model for this winter is concerning. We hope this winter we are done with La Nina for awhile. We will be praying for rain this winter.
We also are hoping for rain…
We also are hoping for rain for drought impacted places out west! The climate outlook for this winter comes out on October 21 to see what the scientists at Climate Prediction Center are thinking.
Cleveland
So what does La Niña/el nino typically mean for Cleveland??
la Niña typically means wetter, milder temps for much of Ohio, correct?
so with more precipitation and warmer/milder temps that means a more active lake mostly right? Milder means the lake doesn’t freeze as quickly.. therefore intensifying lake affect snow? However.. El Niño keeps us colder but drier? Colder means whatever precipitation does come will likely be snow.
how does moderate, strong and weak La Nina’s differ for us? As well as that of El Niño?
i was looking at cleveland snow records going as far back as 1969-1970 up to 2020-2021. There’s no obvious pattern apparent ti me other than a few things..
very strong El Niño usually give us much lower snow averages. There’s been 3 of those in my decades I’ve mentioned and all turned out low snow averages.
strong La Nina’s seem to bring us slightly higher snow totals. Moderate La Niña seems to be about average totals. Weak La Niña seems to vary as well as weak El Niño’s.
just trying to find anyone patterns or things to look at.
another thing work mentioning:
in the 1969-2021 time frame, the highest recorded total was 117.9 and that was the winter of 2004-2005. This was a Weak El Niño. The next highest was 101.1 in 1995-1996, this was a moderate La Niña season. Then 100.5 inches in 1981-1982 and this was a non La Niña/El nino event. But the next highest recorded that was one pattern or another was at 95.7 inches in 2002-2003 = moderate El Niño. Another 90 inches was brought by a weak El Niño in 1977-1978.
seems weak El Niño’s bring about some of the highest snow totals but have also brought significantly lower totals as well. Like the 35.2 inches in 2018-2019.
doesn’t seem like there’s really any common theme though an that both systems vary at any given strength.
Maybe these aren’t so important after all for places like Cleveland ??
You're right! There can be a…
You're right! There can be a lot of variability in winter snowfall for the Ohio Valley and Great Lakes.
Several years ago we invited a guest blogger to look at exactly this topic. Check out this article which should hopefully answer some of your questions.
https://www.climate.gov/news-features/blogs/enso/what-about-snow-during…
How La Ninas affect Connecticut or Rhode Island
How would weak, moderate or strong La Nina affect Connecticut/Rhode Island? How would similar El Ninos affect these areas?
Often times there isn't a…
Often times there isn't a clear signal across the Northeast for La Nina or El Nino. In general there is perhaps a slight tilt towards a wetter winter.
But check back on October 21 for the winter outlook to see what scientists are thinking.
Balance of systems
Regarding: "Overall, La Niña is not more common that El Niño—in the historical record dating back to 1950, there have been 25 El Niños and 24 La Niñas (counting this year). However, La Niña often occurs in consecutive winters, while El Niño rarely does."
If the case is 50-50, then for every La Nina-La Nina double dip, would would have to have a El Nino-El Nino event. Otherwise you could not end up with a 50/50 ratio.
The reversed years have to end up together at some point
What am I missing in this? Thanks!
Hi Bob, Perhaps it'd be…
Hi Bob,
Perhaps it'd be easier to show via a chart.
https://cpc.ncep.noaa.gov/products/analysis_monitoring/ensostuff/ONI_v5…
The total number of events are near equal, it's more about when those events occur. La Nina's tend to occur back to back. While El Ninos are more varied.
Effects of La Nina in Mauritius
Thank you for the update on LaNina 2021. For Mauritius, situated near 20 degrees South and 57 degres East, LaNina starting towards the end of Southern Hemisphere winter has been followed by relatively dry November to March. Bad news for Agriculture!
Drought in California and the Southwest
Why is there an exclamation point on this post?? extending the drought is no fun. Misleading for those of us on the west! Otherwise great info 👍
The meaning of an exclamation point
Interesting... to you, an exclamation point implies something positive? Schoolhouse rock disagrees...
https://youtu.be/yqk3XQk8CqY?t=10
But we definitely do agree with you that the Western drought is not fun. The use of the exclamation point in our title was in the vein of "Oh, no!" or "Look out!"
Not misleading
I interpreted the title in the vein of "We finally have a good guess!" They are researchers after all.
As a Californian like you I am particularly interested in enso as well and love the content here as I continue to educate myself.
While the drought is more likely to continue this is not certain. If you look at the other blog posts there is some good historical data. So I hope for rain anyway. (If I'm wrong please correct me as I'm just an enthusiast)
Additionally there are global implications and while visiting a climate blog, albeit the posts on here are from an American perspective, it's something I would think a lot of people have in mind while thinking climate.
La Nina means different things to everyone. So why interpret global implications from such a small scope and then think the title applies to your specific lens?
I'm sure like me you are personally invested and have strong feelings about the implications, but something to keep in mind for when you come back!
Second year La Nina
Here in California we are hoping the climate models get it completely wrong this year and California gets a good rain/snow year. Another dry year similar to last year is going to be a disaster for California.
So much for models
Living in the SF Bay Area it is wonderful news that a La Nina producing dry conditions this winter is if not 100% wrong at least severely off predictions of moisture based on models. As I type in late December, Bob (and all of NorCal) should be relieved that we are not out of our drought but having a very wet winter with heavy rain in lower altitudes and heavy snowfall in the Sierras.
Anyone know what so radically changed the predicted outcome thus far?
California precipitation
The large-scale atmospheric circulation has been pretty consistent with typical La Nina conditions so far, but the heavy precipitation in the northern half of California shows how important the details can be. I will note that the San Francisco Bay area is located between the driest La Nina signal in the Southwest and the wettest La Nina signal in the Pacific Northwest, so the tendency for dry conditions in central and northern California is not that strong, as reflected in the CPC's Winter Outlook. However, the very wet conditions tied to several atmospheric rivers are still atypical for La Nina. We will have to see how everything plays out the rest of this winter. As Mike's Winter Outlook post pointed out, there have been some La Nina winters that were wet in northern California (e.g., 1955-56 and 1995-96), so perhaps this will be another.
NOAA should fix this for us
It is clear that someone at NOAA has the idea that they can't do anything about these horrible droughts caused by La Nina. I think they need to fix this immediately if not sooner. After all, the are the government and so have the power to do so. There has to be some bright bulbs around there with some geo-engineering ideas to be put to good use. Spread the sulfur!
Different SST Anomaly Values for Nino3.4
I know this is 2 weeks old, but is there a reason that some nino3.4 anomaly values differ so significantly. This site:
https://www.ncdc.noaa.gov/teleconnections/enso/indicators/sst/
Reports Nino3.4 anomaly for September to be -0.29. IRI also seems to Suggest values greater than -0.5?
Tom talked about the various…
Tom talked about the various sea surface temperature monitoring datasets in an earlier post. (The images will be restored soon--we're still upgrading old posts on our new climate.gov website.) They all have different inputs (the actual measurements), methods of going from single-point measurements to a regular grid, and even reporting periods--daily, weekly, or monthly. There are usually differences between the temperatures in the various datasets, and a difference of 0.2 degrees isn't unusual. We do pay close attention to the temperatures, though, and sometimes it becomes evident that one of them has an error. We think this is just the "normal" uncertainty in the data, but we'll keep an eye on it.
Ocean temperature changes
The explanations for ocean changes seems to focus on above surface effects. What about Pacific trench volcanic activity impacts on temperature and circulation?
undersea volcanic effects
For the most part, the amount of heat transferred to the ocean from undersea volcanoes is very small relative to the heat exchange at the ocean surface, so the effects of these volcanoes on ocean temperature and circulation and on earth's climate are very small. However, that may not be true for very long timescales.
La Niña affects black ice frequency in New England
Years with a La Niña tend lead to more frequent and unpredictable black ice in New England. It's quite clear in late fall as nights fall below freezing and days are above freezing- nobody salts the roads, so black ice forms nearly every night and melts by noon the next day instead of forming and immediately being salted during colder El Niño years due to temps falling, consistently, below 0C, day and night. Not much science here, just how it is since the black ice is only an issue due to human elements and not due to a meteorological issue.
Interesting observation,…
Interesting observation, Alex! I'm not aware of any studies that investigate large-scale predictors of black ice (ENSO or otherwise), so it would be interesting if such connections could be solidified and quantified.
Japan
What do you think the effects of this year's La Nina will be on Japan? Particularly in terms of snowfall? Last year's La Nina brought early, very heavy snow but abnormally mild temperatures in February, which is usually the coldest month.
Awesome post!
Having taken Meteorology courses at Penn State….I can say this post is very well thought out and informative. Keep up the great work!
Comments have been disabled on this article