Were Model Predictions of El Niño a Big Bust?
Believe it or not, we ENSO forecasters follow what is being written on various news sites, blogs, and social media. Some of us have twitter accounts: @ejbecker and @TDiLiberto. And don’t forget to follow @NOAAClimate for updates on our latest posts. You inspire us! Many of the topics in our blog come from your questions or ideas you provide. You lead us to think a little harder about the questions we’d like to investigate. And, as of late, we have noticed that there has been some chatter about how the models were wrong about their prediction of El Niño during 2014. Is this true? The answer may surprise you.
In the figure below are model predictions for ENSO created during January through December 2014. These are predictions for just one index: sea surface temperature (SST) departures from average in the Niño-3.4 region of the east-central equatorial Pacific (1). Each individual purple line represents a prediction from a different model. These models are run by many different national agencies or universities. Superimposed on it is a black line, which is what actually happened in 2014 (“observations”). So take a good hard look at them. What do you notice?
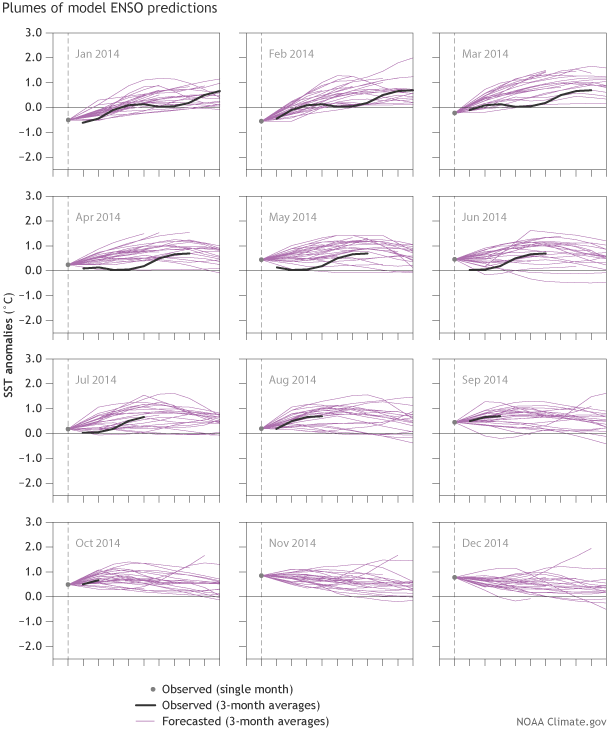
Model forecasts of 3-month average sea surface temperature (SST) anomalies in the Niño-3.4 region (one index to measure ENSO) from 2014. Each purple line represents the ensemble mean forecast from a different model. The black line shows the SST observations from ERSSTv3b (NOAA NCDC). The grey, dashed vertical line is the forecast start point from the observed, 1-month value, while each successive point shows the 3-month (seasonal) values. There are no SST observations (black line) shown in the panels labeled November and December 2014 because we do not yet have the DJF and JFM 2015 observations. El Niño conditions often occur when the Oceanic Niño Index/ONI or the 3-month average of Niño-3.4 SST ≥ 0.5°C. Graphic by Fiona Martin for NOAA Climate.gov.
Here are some things we take away from this:
(a) Throughout 2014, the range of possible outcomes included both El Niño and no El Niño at all (or ENSO-neutral). Notably, very few models ever suggested a major El Niño event (2). We obtain the range, or spread, using many runs from one model (an ensemble) and/or many runs from many different models (multi-model ensemble). Informally, a “strong El Niño” occurs when the ONI is ≥ 1.5°C (the ONI value for the 1997-98 El Niño was 2.4°C at its peak) and many of the purple lines do not exceed this threshold. In contrast, most of the year, the average forecast of the models predicted a “weak El Niño” (ONI at least 0.5°C but less than 1°C).
(b) The black line stays within the range of the purple lines, meaning that the observations were generally within the “envelope” of what all of these models were predicting (3). In multi-model and ensemble prediction, one measure of success is whether observed reality occurs within this model envelope (4). While ideally you might prefer to be given just one answer or a very small range of possible outcomes for the future, this is of no use if what occurs is always outside of the prediction. The ensemble approach tries to incorporate the inherit uncertainty of the atmosphere-ocean system and also strives to provide reliable betting odds over time.
(c) 2014 was either the worst possible year to start an ENSO blog or the best. Most folks on our team consider this among the trickiest forecasts we have ever been a part of. Such a borderline El Niño is a challenge and one we are still trying to communicate. But, on the up side, we hope you can see that this isn’t an easy business to be in and there are still important questions we still need to work on. Leading us to…
(d) El Niño prediction is not “solved.” It wasn’t at the beginning of 2014 and it isn’t now. There are still big challenges we face and it will take a lot of time and effort to analyze the data to better understand ENSO and informed by that new knowledge, predict it with greater accuracy. And it is not just of consequence for seasonal prediction -- many of the long-term projections of local and regional climate change critically depend on better understanding and modeling of ENSO and its teleconnections (e.g. Berg et al., 2015).
The public discussion is exciting and we love seeing so much passion and curiosity for ENSO. Some of you seem to look forward eagerly to El Niño by providing names for it like the “Mitt Romney El Niño” (will it run yet again?) or “El Niño Lazarus” (rising from the dead?). And, you over there, with your idea to start an Oceanic and the Kelvin waves band, with its smash hit: “I am Walking on the Thermocline”-- very clever.
At the beginning of 2014, the possibility of a major El Niño was just that: one among many possible outcomes. In other words, while forecasters couldn’t rule out an event of that size early on, a strong El Niño was never the most likely outcome and, furthermore, there was always the chance of no El Niño at all. ENSO prediction comes with a large range of outcomes (5), and forecasters try to express this uncertainty with our probabilities (what is the % chance of El Niño?) and more qualitatively in our regular monthly discussions. We hope you click here, here, here, and here for more on how to interpret the models and probabilistic forecasts and, of course, stay tuned to updates on our ENSO blog!
Footnotes
(1) These are the exact same IRI/CPC model plumes that have been shown in the past year of ENSO monthly discussion and weekly updates. Archive of ENSO Diagnostic discussion and associated figures are available in this link.
(2) Keep in mind that each line in the IRI/CPC ENSO plume is based on an intra-model ensemble mean, which means that the constituent model members are averaged together and are not displayed in the graphic. If they were shown, the full spread of outcomes would be larger than what is presented. So, while the ensemble means largely did not favor a strong El Niño, the addition of these members would have clearly indicated some chance of a strong episode. For an example of the full spread of members + ensemble means, check out the North American Multi-Model Ensemble plume (click “All Members”) to see the full spread of individual members that are associated with each model. Archive of NMME predictions can be viewed in this link.
(3) Clearly, the model forecasts made during the Northern Hemisphere spring of 2014 (March, April, May) were not as skillful as the rest of the year. It is difficult to see, but there is one model that sits on the x-axis for forecasts initialized in April 2014 (another version is in this link), so even then, the observations were within the range of the spread of models. In general, models that are initialized during the spring months are less skillful (also known as the “spring predictability barrier”).
(4) As the number of models increases, the range covered between the lowest and the highest forecasts typically increases (and this is true to an even greater extent if all ensemble members, and not just the mean, are displayed; see footnote 2 above). So when there are a very large number of forecasts, it is a low bar to claim “success” when the observation falls within a huge range. So, it is generally preferred that the observations occur within the tightest clustering (or highest probability) of the purple lines. One can also redefine “success” to exclude the far extremes in the range of forecasts, such as only when the observation falls within the middle 90% of the forecast range. In the case of the IRI/CPC ENSO forecast plume, with its 20 to 26 model averages shown, it is reasonable to use the range formed by all of the models, or, to be slightly stricter, the range from the second lowest model to the second highest one.
(5) With that said, the models clearly favored reaching El Niño SST thresholds and is why an El Niño Watch was issued in early 2014. The SST thresholds (ONI ≥ 0.5°C) were exceeded for several overlapping seasons in late 2014/early 2015. But, as explained in previous posts, the lack of a clear overlying atmospheric response has, to date, prevented ENSO forecasters from declaring the onset of El Niño conditions.
Reference
Neil Berg, Alex Hall, Fengpeng Sun, Scott Capps, Daniel Walton, Baird Langenbrunner, and David Neelin, 2015: Twenty-First-Century Precipitation Changes over the Los Angeles Region. J. Climate, 28, 401–421.
Comments
Really? Still?
Nino
Your ENSO Blog
RE: Your ENSO Blog
Predictions
So, in short, you cannot be
El Niño Big Bust
ice age or warming
Add new comment