Like day and night: How summer afternoons 'listen' to spring rains, and nights don't
What a difference the day makes
In the last Beyond the Data entry, we investigated the role that late-spring rainfall plays in summer temperatures. The short, short version:
For much-to-most of the contiguous United States (CONUS), summer temperatures have a relationship with (they “listen to”) late spring precipitation. Wetter places in June tend to be cooler through summer, but the tendency is slight. The relationship is not very strong to begin with, explaining about a quarter of the variance, and diminishes to zero away from the south and interior parts of the CONUS.
I subsequently got a note from a great colleague from back in my state climate office days. Jim Angel, the Illinois state climatologist, had been discussing the phenomenon with Dennis Todey, the South Dakota state climatologist. Jim wrote that it would be even more interesting to look separately at Tmax (“maximum temperature,” essentially afternoon high temps) and Tmin (“minimum temperature”, essentially morning lows), because looking only at the average temperature might mask some interesting features.
Knowing instantly that Jim was correct, I did what any self-respecting climate writer would do in that situation: I replied by email, pretending that I intended all along to cover Tmax and Tmin in a follow-up post. Please don’t tell Jim or Dennis. Let’s keep that between us.
It’s like night vs. day
Late-spring/early-summer rainfall should affect summer’s daytime temperatures considerably more than its nighttime temperatures. In the last post, we mentioned that dry soils would tend to just get hotter (“sensible heating”), while wet soils would use some of the incoming energy to evaporate water (“latent heating”), leaving less energy to actually raise the temperature.
That’s what Jim and Dennis are getting at. For incoming solar energy to be divvied up, it’s pretty substantially relevant that the Sun be, you know, above the horizon.
The maps just below show the relationships between June precipitation and summer’s Tmin (top) and Tmax (bottom). As is usual, Jim was right on the mark. The difference between the two is massive, even more than I expected.
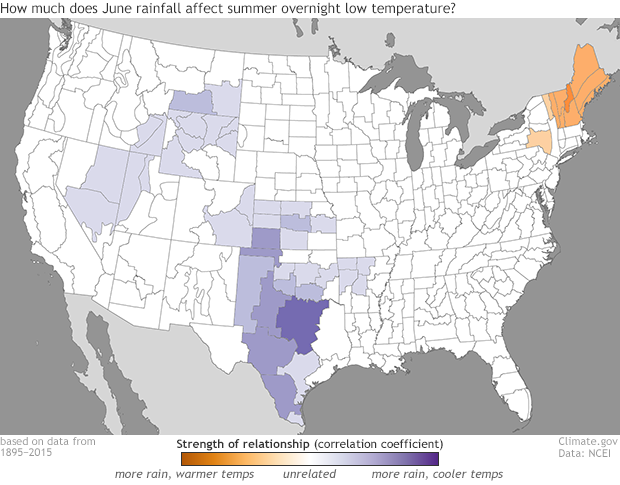
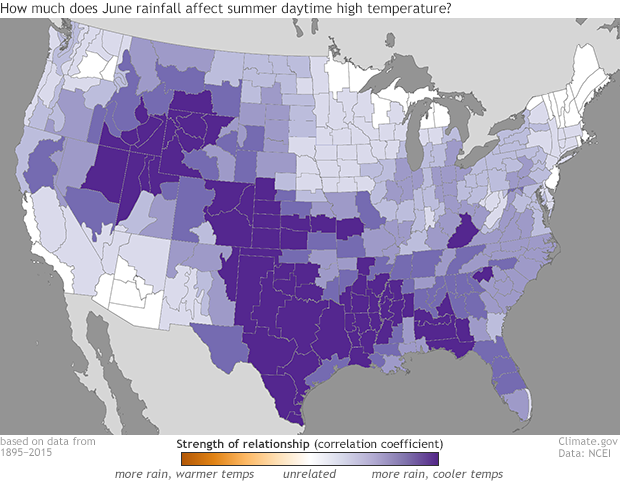
The strength of relationship between each climate division's June rainfall and its effect on summer's morning temperatures (top map) and afternoon temperatures (bottom map). Analysis based on 121 years (1895-2015) of NOAA/NCEI nClimDiv data.
So, what are some of the takeaways?
First, the effect of late spring precipitation on summer temperatures, such as it is, is almost entirely driven by its effect on afternoon temperatures. Again, this makes sense, because this is the time of day that heating—and the divvying up thereof—occurs.
In parts of the nation’s interior, up to 40% of the year-to-year variance in summer afternoon temperatures can be explained by June precipitation. That’s a lot of signal in a complex climate. In your own complex life, this would be like 40%—two out of five—of your good/bad days being explained by, say, whether a particular stoplight on your morning commute was red or green. It’s huge.
I think some of the more interesting areas on the Tmax map are where the signal is non-existent—places where June rainfall fades into obscurity, accounting for a negligible piece of summer temperature outcomes.
For example, the relationship is obviously weaker in the northern CONUS. We covered this in the last blog: there’s just not as much summer sun up there, for one thing, and the jet stream (aka “weather patterns”) remains active in the area. An active jet brings weather into a region, overwhelming more local effects such as soil moisture.
The Northeast is decidedly insensitive to June precipitation. In fact, in parts of New England, the signal reverses: wetter Junes are (very slightly) related to warmer minimum temperatures in the summer. Again, in New England, there’s less solar heating to divide up. But more importantly, southerly winds are important to precipitation in the area, so a warm southerly fetch in June can bring both warmth along with the [heavier] precipitation.
My favorite Tmax non-feature is in Arizona and the surrounding Four Corners region, where the signal diminishes to zero. The Four Corners region is just as “south” as the Southern Plains, so you might expect it to have a similar relationship between June rainfall and summer temperature. The lack of a connection shows the influence of the North American Monsoon on summer temperatures on the Colorado Plateau. The North American Monsoon just doesn’t “care” about local-scale early summer precipitation. Its patterns are more connected to regional interaction with the ocean, and follows a different set of drivers entirely.
There’s also a noticeable weakness in Tmax signal in the Corn Belt, at least the Iowa/Eastern Nebraska part of it. That’s a mystery for another day - and perhaps the expertise of a local pro, like, say a state climatologist from the region!
Coda
This effect has been known for decades, under a number of various names of the day. More than 15 years ago (dang), I wrote my Master’s thesis on a variation of the topic. I cited my current boss, who wrote about it 15 years earlier. This week’s blog isn’t covering particularly novel territory.
However, what does change over time is the quality of data. We can now see climate history more clearly than ever, and researchers can put more precise and more confident numbers on these kinds of relationships. That increased confidence helps in a number of ways: it may lead to better seasonal forecasts, and more immediately it helps businesses that factor weather and climate into their operations. If you’re in the logistics business, or the transportation business, or the agriculture business, you’re in the climate business, too.
Thanks to years of work by my colleagues in the field, and especially here at the National Centers for Environmental Information, it’s not just our climate history that comes into clearer focus, but parts of our understanding as well.