Steam baths and ovens: soil moisture in the summer
In climate monitoring, we often use the term “outcome” to describe the results of a season. For example, “For most of the United States, seasonal outcomes during spring 2012 included a record-warm March and a record-warm spring.”
Outcomes in climate—like in life—are a combination of factors. And at certain times of year—like certain times in life—different factors emerge as relatively more important to an outcome. In climate, spring dampness is one of those factors that emerges as important for warm season outcomes, particularly for the interior of the continent.
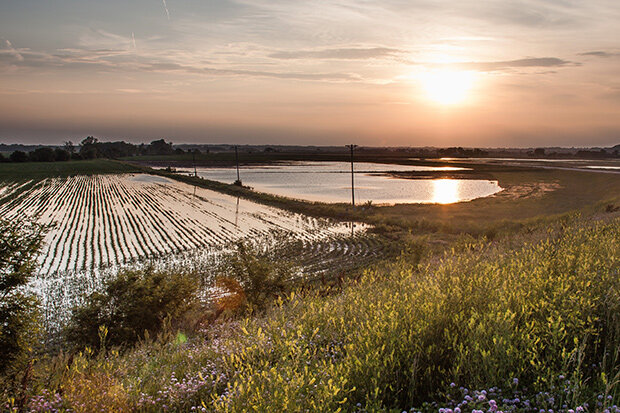
The Sun shines down on a flooded cornfield near Orrick, Missouri, on June 6, 2015. When the ground is wet from spring rains, the summer Sun has to evaporate the water before the ground really srtarts to heat up. Photo by Vincent Parsons, via Flickr. Used under a CC license.
This week, we’ll go Beyond the Data to examine how spring precipitation influences summer temperatures, and why this matters a little more in land-locked areas. Flyover Country, from one of your native sons, this blog’s for you.
Dry springs can invite hotter summers
The punchline of this blog is pretty straightforward: for much of the interior United States, the precipitation you get in the late spring can make a difference in temperature outcomes for the summer.
Here’s some background: in the summer, because the sun is high in the sky and days are long, the Earth’s surface (that’s where we live) absorbs a heck of a lot of energy. The amount of moisture in the soil can control how much of that incoming energy goes into raising the surface temperature (“sensible heat”) and how much goes into evaporating water (“latent heat”).
As you might guess, and have probably experienced, drier soils mean more sensible heating and less latent heating, which means higher temperatures. This is the “dry oven” scenario - almost all of that incoming energy is devoted to making the temperature go up. With wet soils, temperatures stay lower as more energy is consumed by the process of evaporating water. This is the “steam bath” scenario—the temperature stays lower, but there’s more water vapor added to the air.
A recent, and extreme, example
Folks in the southern plains saw the “dry oven” scenario in spades in the spring and summer of 2011. During the spring, while the Ohio and Mississippi Rivers saw epic flooding, Texas and Oklahoma were dry—really dry. Most of the region racked up more than half a foot of rainfall deficits during the April-June period, which is the wettest stretch of a normal year.
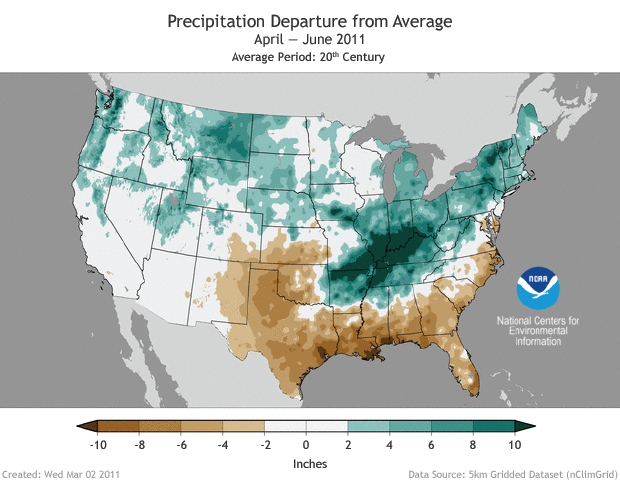
Precipitation for April-June 2011 compared to the twentieth-century average. The Southern Plains and Gulf Coast were much drier than average (brown), while the Upper Mississippi and Ohio Valleys were wet (green). NOAA NCEI map by Deke Arndt.
By the end of summer, the region was not only mired in drought, but it was colossally hot. Oklahoma and Texas ended up in a neck-and-neck race for the hottest summer for any state on record, passing up some legendary competition. In the meantime, the waterlogged Ohio Valley stood out as a near-normal exception within a larger field of warmer-than-normal conditions.
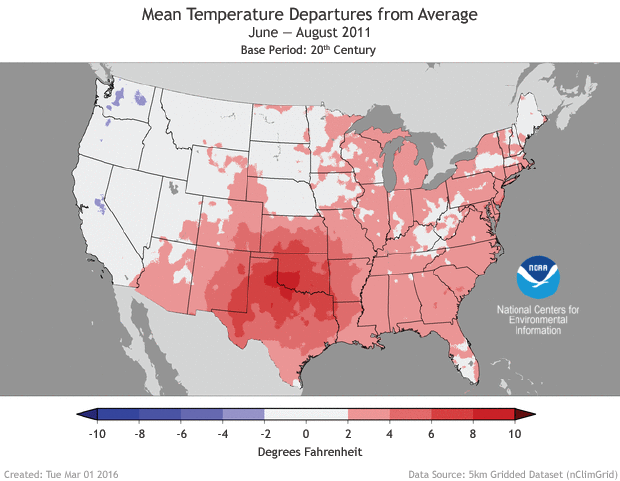
Temperature for June-August 2011 compared to the twentieth-century average. The Southern Plains and Gulf Coast were much hotter than average (red). The spring wetness in the Ohio Valley probably helped keep the temperatures in the Ohio Valley closer to normal (white). NOAA NCEI map by Deke Arndt.
So, how prevalent is this signal?
So, I’ve identified a pattern, a relationship between spring precipitation and summer heat. Climate scientists call that sort of pattern a “signal” (as opposed to just weather and climate “noise.”) But if you’re wondering how widespread the signal is…the answer is not very. The map just below shows the strength of relationship between late-spring rainfall (June, to be precise), and summer temperature.
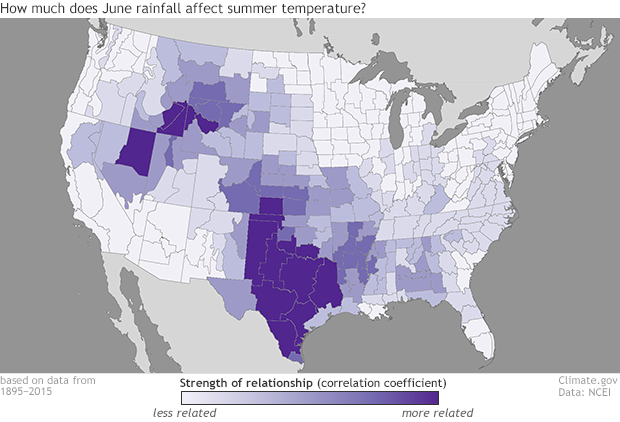
This map shows the correlation between June rainfall and the June-August temperature over the span of the historical record (1895-2015). Places where June rainfall explained less than 5% of the year-to-year variability in summer temperatures are colored light purple. Darkest purple shows places where June precipitation accounted for 25% of more of the variability in summer temperature. Map by Deke Arndt.
A few key points can be made:
- There is some signal. Places with some shading show some relationship between summer temperature outcomes and June precipitation. In those places, all else being equal (though it’s usually not), wet conditions late in the spring tilt outcomes toward cooler summers, while dry times tip the hand toward hotter summers.
- There’s not much of a signal. Even for places with the darkest shades, only a quarter of the variability in summer temperatures can be explained by June precipitation. The other three quarters are driven by other factors: teleconnections, precipitation on other time scales, circulation patterns, random weather, whatever. For the lighter shades, there’s even less signal. Where the map is white, the signal is negligible: basically no connection between late spring precip and summer temperature
- The strength of the signal is tied fairly noticeably to geography. First of all, the south tends to be more shaded than the north. Down south, there’s even more solar energy to divide up between “dry oven” and “steam bath” scenarios. Plus, active weather patterns tend to migrate poleward for the summer, leaving behind a more weak and disorganized picture in the south —the summer doldrums. This makes room for more subtle influences to show up.
There’s also more of the darker shading (stronger connection) towards the interior of the continent. It’s not a perfect match, but in general, the oceans have a moderating effect on both temperature and precipitation. Away from the oceans, in the nation’s heartland—again, all things being equal (and, again, they’re usually not!)—local summer temperatures outcomes can take on the shape of recent rainfall history.
Bottom Line
The spring 2016 wetness in the nation’s heartland may be worth watching. If that pattern holds for the next couple of weeks, and if we get locked into a summer doldrums situation, temperatures in those areas may be a little lower than the neighboring regions. Indeed, the Climate Prediction Center noted soil moisture as one factor (of several) that led to a lower probability of a warm summer in the region relative to the rest of the U.S.
Thanks for going Beyond the Data.