In the U.S., year-to-date temperature and precipitation patterns not playing by their usual rules
This year so far has been one of the warmest on record for the contiguous United States, with the January-July temperature ranking as the 2nd highest since records began in 1895. It has also been a wetter than average year (even before Hurricane Harvey), with the precipitation total for the first seven months of the year ranking as the seventh wettest in the 123-year record.
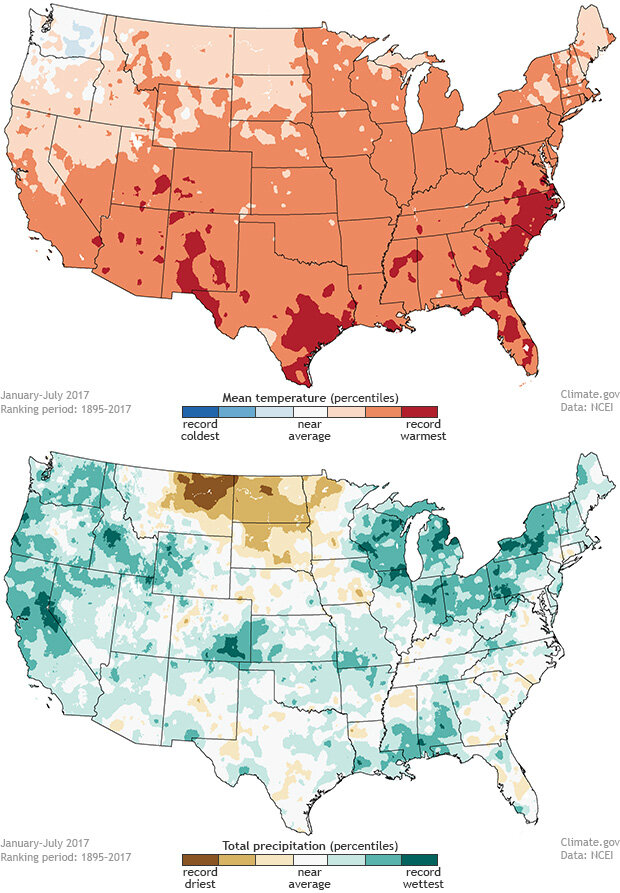
Year-to-date (January-July 2017) temperature and precipitation ranks for the contiguous United States. NOAA Climate.gov maps adapted from NCEI originals.
Temperature and precipitation ranks for 2017 to date
This warm-wet pattern is somewhat contrary to the general rule of thumb about how temperature and precipitation go together in the contiguous United States. It is typically the dry years that are unusually warm, while in the past, wet years were generally cooler.
This Beyond the Data post will examine why 2017 has been so warm and wet while in the past most of the warm years have tended to be dry for large parts of the country.
The Sun dries and warms
To understand why warm years tend to be dry, we have to examine how the sun’s energy interacts with water that is in or on the ground. When there is above-average precipitation, the ground holds more water. When the sun’s energy hits wet ground, a portion of it evaporates the water instead of warming the ground and the air, keeping temperatures lower. Also, above-average precipitation usually means more clouds, which prevents the sun’s energy from even reaching the ground, and that also keeps temperatures cooler.
When there is below-average precipitation, and the ground is dry, more of the sun’s energy warms the ground and the air. That will cause temperatures to be warmer compared to when the ground is wet. The additional warmth will also speed up evaporation, causing the ground to dry out even more. Also, below-average precipitation usually means less cloud cover, which allows more of the sun’s energy to make it to the ground.
The relationship between precipitation and temperature holds true for most times of the year, but the biggest influence tends to be during the warmer parts of the year. During the warm season, the sun’s high angle in the sky brings more direct sunlight, and precipitation and cloud cover—or their absence—have larger impacts on temperatures.
Testing the rule: examining warm and dry years on national scale
One way to look at the impacts of dryness on national temperature outcomes is to compare the percent area of the contiguous U.S. experiencing moderate to extremely dry conditions to the nationally-averaged temperature and temperature rank. Using the percent area statistic in this comparison instead of actual rainfall shortfalls helps to take into account each location’s climate.
For example, if the Midwest usually receives a lot of precipitation in the summer and a particular year is wetter than average for the region, it will have a different impact on national-scale statistics compared to the desert areas of the West having a relatively wet summer compared to its own history. Using this percent area statistics helps to normalize the variability between regions. The percent area statistic is based on the Palmer Drought Index, which takes into account accumulated dryness over the past several months and is a good gauge of longer-term dry conditions.
Connection between national temperature ranks & the extent of "very dry" areas |
||||
| January-July year | Temperature rank | Precipitation rank |
"Very dry" area (percent of U.S.) |
|
| 2012 | 1st warmest | 17th driest (tied) | 64.7 | |
| 2017 | 2nd warmest | 7th wettest | 8.8 | |
| 2006 | 3rd warmest | 17th driest (tied) | 53.8 | |
| 2016 | 4th warmest | near average | 24.4 | |
| 2000 | 5th warmest | 34th driest | 45.6 | |
| 1934 | 6th warmest | 1st driest | 78.8 | |
| 1986 | 7th warmest | 30th driest | 16.5 | |
| 1921 | 8th warmest | 36th driest | 16.6 | |
| 1990 | 9th warmest | 16th wettest | 26.5 | |
| 1998 | 10th warmest | 1st wettest | 17.9 | |
The table shows the ten warmest January-July periods for the Lower 48, the precipitation rank for that seven-month period, and the July percent area of the nation moderately to extremely dry. While the national precipitation rank isn’t as clearly correlated with the seven-month temperature, the percent area of dryness is. Among the 10 warmest January-July periods, only 2017 had less than 10 percent of the nation experiencing very dry conditions.
Plotting the data for all 123 January-July periods on record, the relationship between the national temperature rank and the percent area of U.S. experiencing dry conditions is clear. A couple years of note are highlighted, showing how the relationship between these two variables in the past have generally followed the rule of warm-and-dry and cool-and-wet, with 2017 clearly an outlier.
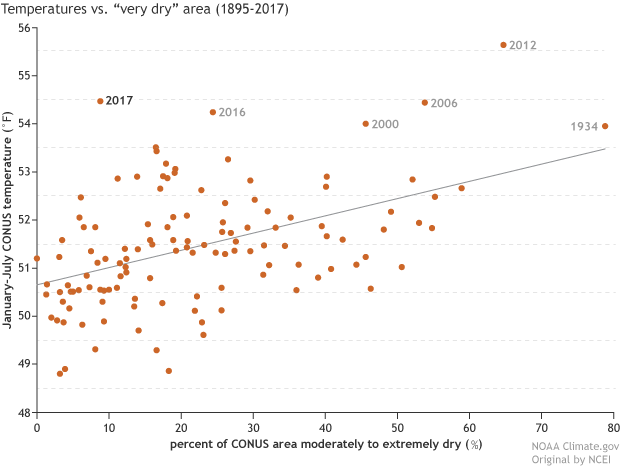
If we plot the percent of the contiguous United States experiencing moderately or extremely dry conditions (horizontal axis) versus the average January-July temperature, we can see how, in all 6 of the warmest years on record—except 2017—more than 20% percent of the U.S. was experiencing very dry conditions. NOAA Climate.gov graph, adapted from original by Jake Crouch, NCEI.
But why?
Why has 2017 been such an outlier? One answer is that we live in a big country and the weather and climate conditions vary a great deal between regions and times of the year. Another reason could be the changing influence of minimum temperatures compared to maximum temperatures on the national average temperature.
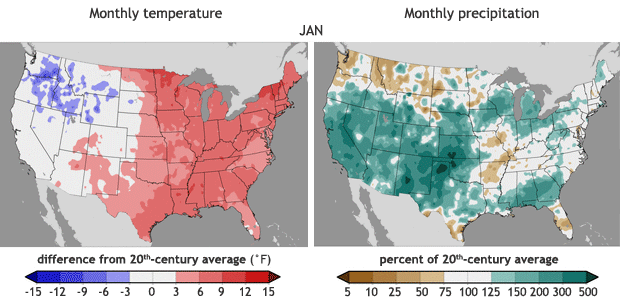
Monthly average temperatures (left) and percent of average precipitation (right) compared to the twentieth-century average for January-July 2017. Notice how the very warm areas contributing to this year's near-record warmth shift around from place to place. It's more common for a very warm year to result from more persistent warmth—and eventually dryness—over a consistent area. Animation by NOAA Climate.gov, based on originals by Jake Crouch, NCEI.
Let’s first look at the regional and seasonal differences in temperature and precipitation across the country in 2017. Throughout much of 2017, the general weather pattern across the contiguous U.S. has not been consistent, with locations that were experiencing warm or cool conditions changing nearly every month. When it was warm for a region, temperatures tended to be record or near-record warm. If it was cool for a region, record and near-record precipitation usually accompanied the below-average temperatures.
This overall pattern of it being really warm and really wet at alternating times of the year helped to push the Lower 48 to this warm and wet year. In the past, when we have experienced really warm years, the general spatial pattern across the contiguous U.S. tended to be more consistent from month to month.
Another contributing factor to the unusual conditions in 2017 could be climate change. Over the past 123-years, the daily minimum temperature (overnight lows) have warmed at a faster rate compared to the daily maximum temperature (afternoon highs). The relationship between precipitation and temperatures described above has a larger influence on maximum temperatures, since the cooling influence of wet ground is more significant in the daytime, when the sun is out.
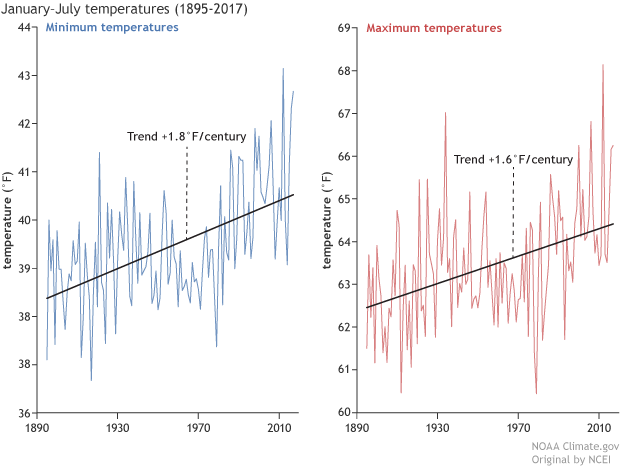
In the contiguous United States, minimum (overnight low) temperatures (left) are rising slightly faster than maximum (daytime high) temperatures (right). The cooling influence of wet ground matters less at night, which may partially explain why this year has been so warm, even though it's been wet. NOAA Climate.gov graph, adapted from original by Jake Crouch, NCEI.
For 2017 so far, the maximum temperatures ranked as the fourth warmest on record at 3.0F above average, while the minimum temperature ranked as the 2nd warmest on record at 3.4F above average. This indicates that the minimum temperatures influenced the national temperature more than the maximum temperature this year and that may explain why the ”warm years are dry years” rule was broken.
So far, 2017 has been an extreme year. Temperatures and precipitation have been above average. The Climate Extremes Index ranked as the third highest on record. There have been nine billion dollar weather disasters. Hurricane Harvey broke the record-long streak of a major hurricane not hitting the United States. This year has also broken the mold in terms of how we think about the relationship between precipitation and temperature outcomes for the nation. Could this be a symptom of climate change or a potential new aspect of understanding climate and weather interactions? Well, that remains to be seen.
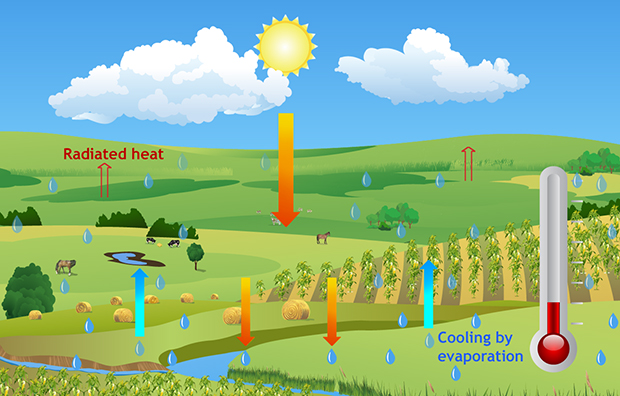
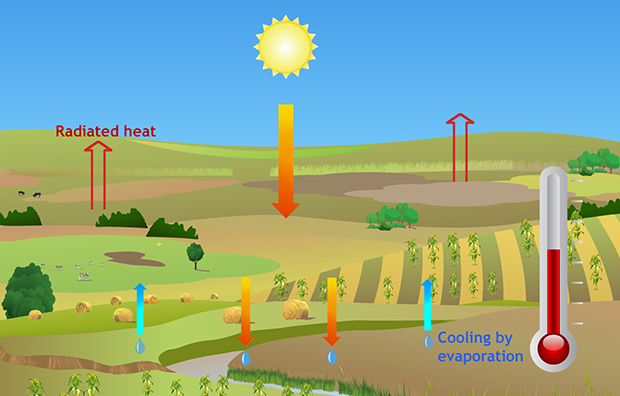
When sunlight reaches Earth's surface, it may be absorbed by the soil, water, or vegetation, where it is converted into heat energy that warms the surface and atmosphere. But incoming sunlight may also drive evaporation, converting liquid water into vapor without changing the surface temperature. When the ground is dry, more of the incoming sunlight gets turned into heat., which is why dry years tend to be hot ones. NOAA Climate.gov drawings.
Comments
El nino
RE: El nino
Have a look at our ENSO blog post discussing the August outlook. The Sep. outlook will be discussed in an ENSO blog post on Sept. 14, so stay tuned.
total precipitation to date for Greater Cincinnati area
RE: total precipitation to date for Greater Cincinnati area
Apologies, David, but the email system that notifies us that comments have been posted broke down last month, and we didn't notice til now. For questions such as this, please send an email to our Website's Maps and data mailbox: climate-dataandservices at noaa.gov (no spaces and replace "at" with the symbol. Thanks!
Add new comment