Beyond the Data Blog
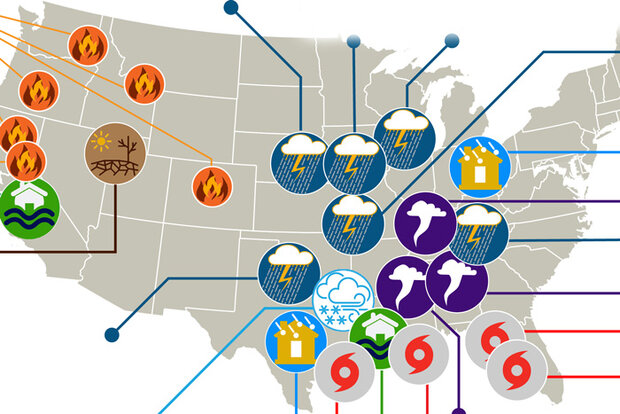
Last week, our team at NOAA National Centers for Environmental Information (NCEI) released the final update to its 2021 Billion-dollar disaster report (www.ncdc.noaa.gov/billions), confirming what much of the nation experienced throughout 2021: another year of frequent and costly extremes. The year came in second to 2020 in terms of number of disasters (20 versus 22) and third in total costs (behind 2017 and 2005), with a price tag of $145 billion.
2021 Highlights
In 2021, the U.S. experienced 20 separate billion-dollar weather and climate disasters, putting 2021 in second place for the most disasters in a calendar year, behind the record 22 separate billion-dollar events in 2020. &nbs…
Read article
NOAA’s National Centers for Environmental Information (NCEI) has released the final 2020 update to its Billion-dollar disaster report (www.ncdc.noaa.gov/billions), officially confirming what communities across the nation experienced first-hand: 2020 was a historic year of extremes.
There were 22 separate billion-dollar weather and climate disasters across the United States, shattering the previous annual record of 16 events, which occurred in 2017 and 2011. The billion-dollar events of 2020 included a record 7 disasters linked to tropical cyclones, 13 to severe storms, 1 to drought, and 1 to wildfires. The 22 events cost the nation a combined $95 billion in damages.
Adding the 20…
Read article
NOAA’s National Centers for Environmental Information (NCEI) tracks U.S. weather and climate events that have great economic and societal impacts (www.ncdc.noaa.gov/billions). Since 1980, the U.S. has sustained 258* weather and climate disasters where the overall damage costs reached or exceeded $1 billion (including adjustments based on the Consumer Price Index, as of January 2020). The cumulative cost for these 258 events exceeds $1.75 trillion.
During 2019, the U.S. experienced a very active year of weather and climate disasters. In total, the U.S. was impacted by 14 separate billion-dollar disasters including: 3 major inland floods, 8 severe storms, 2 tropical cyclones (Dorian an…
Read article
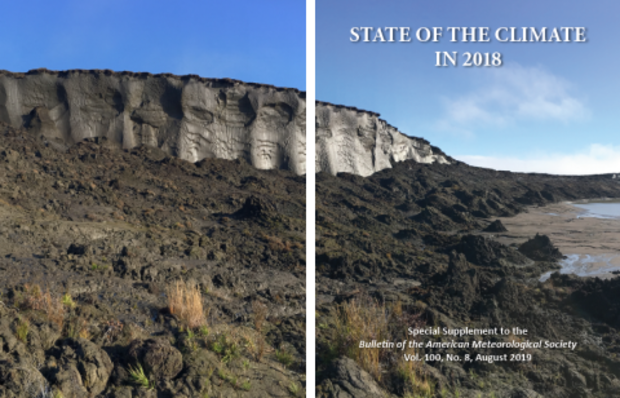
The climate system we share is big and complex. Assessments like the State of the Climate depend on expertise from around the world and around the sciences. This year's "Meet the Author" profile features two contributors to the African section of the "Regional Climates" chapter. Their leadership and perspective make the report stronger. Both are involved in international work, often with the World Meteorological Organization (WMO), that brings their expertise to the regional and global arena.
Fatou Sima is the Principal Meteorologist overseeing the Meteorological Division and Climatological unit in The Gambia's Department of Water Resources. She received her M.Sc. in Applied Meteorol…
Read article
Raining on your parade
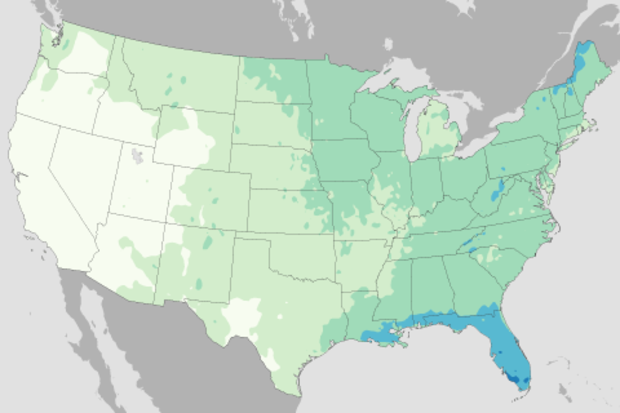
NOAA’s National Weather Service will soon be issuing forecasts for Independence Day (find your local forecast), but here’s a look at the historical probability that your Fourth of July picnic will be rained on, based on observations from 1981-2010.
If all we had to go on was history, this map says the best chances of clear skies in the contiguous United States (CONUS) would be found, not surprisingly, in the West. Based on past Fourths of July, chances for rain are 10 percent or less for a large area from interior Washington to northwest New Mexico. In the CONUS, the highest chances for rain on your parade would be in southern Florida (40-50%), foll…
Read article
