August 2020 ENSO update: ahoy, mateys
The chance of La Niña developing this fall is up slightly from last month, at around 60%. Our La Niña Watch continues!
Becalmed
The Oceanic Niño Index—the three-month mean sea surface temperature anomaly (difference from the long-term mean, 1986-2015 in this case) in the Niño3.4 region—was -0.2°C during May–July 2020. The Oceanic Niño Index is our official metric for ENSO (El Niño/Southern Oscillation). -0.2°C is solidly in the “neutral” category of greater than -0.5°C and less than 0.5°C, so we continue in ENSO-neutral conditions for now.
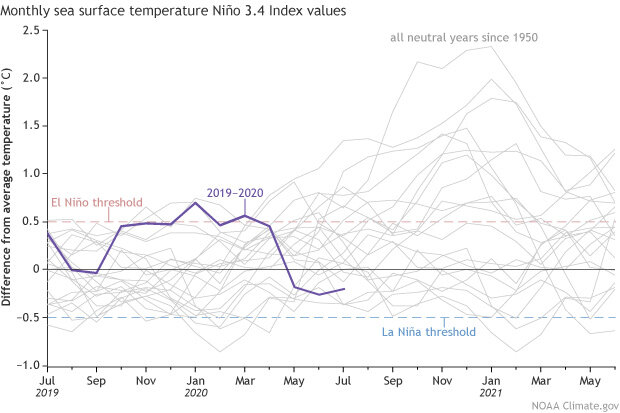
Monthly sea surface temperature in the Niño 3.4 region of the tropical Pacific for 2019-2020 (purple line) and all other years starting from neutral winters since 1950. Climate.gov graph based on ERSSTv5 temperature data.
The current 60% chance of La Niña is largely based on the dynamical computer models, most of which slightly favor La Niña in the fall and winter.
Fair winds and following seas
The near-surface winds over the equatorial region—the trade winds—blow steadily from the east to the west near the equator. Well, I always describe them that way, but technically they blow from the northeast to the southwest on the north side of the equator, and from the southeast to the northwest south of the equator! (You can see why I simplify it sometimes, especially since the easterly component is what matters the most for ENSO.)
The trades result from the Hadley circulation—when heated air rises in the tropics, it ascends to the upper level of the atmosphere and then travels to the north and south. It descends again in the mid-latitudes, and travels back toward the equator near the surface.
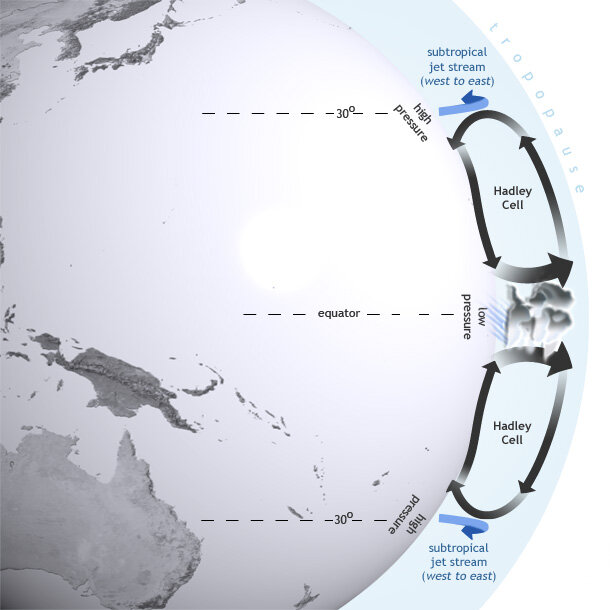
El Niño influences global atmospheric circulation by intensifying the Hadley circulation, in which heat is transferred from the Earth's surface to the upper atmosphere through convection and latent heating. Map by NOAA Climate.gov.
Because the Earth is spinning, the winds traveling toward the equator are bent to the right in the northern hemisphere and to the left in the southern hemisphere (the Coriolis effect). The Earth spins eastward, so winds headed toward the equator veer off to the west—the opposite direction of Earth’s rotation.
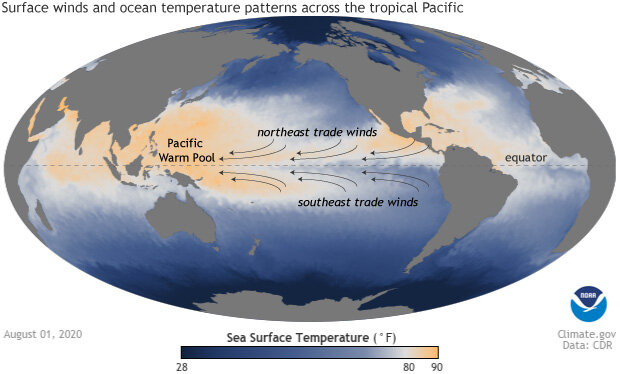
The Pacific warm pool and trade winds. NOAA Climate.gov map from the Data Snapshots map collection.
The trade winds help to keep warmer water piled up in the western side of the tropical Pacific (the Pacific warm pool), and we keep a close eye on them for ENSO prediction. When they relax, the surface water warms, and warmer-than-average water can shift eastward under the surface. (Form of: a downwelling Kelvin wave!) When they’re stronger than average, they can cool the surface, and result in an upwelling Kelvin wave: cooler-than-average subsurface water moving eastward.
Recently, the trades have been stronger, and the surface has cooled in the east-central Pacific Ocean. Also, the amount of cooler water under the surface has begun to increase again, which is a bit of a relief for forecasters, because it had been diminishing when we issued the La Niña Watch last month. This development supports the models’ forecast of La Niña, since cooler subsurface water will reinforce the surface cooling.
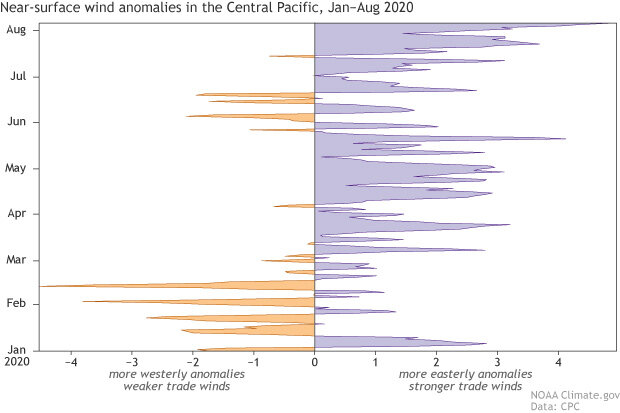
Daily near-surface (950 hPa) wind anomalies in the central Pacific, averaged over the area 5S-5N, 170E - 200E. January 1st 2020 is at the bottom of the graph, and August 6th 2020 is at the top. Purple areas show where the trade winds were stronger than average, while orange areas indicate weaker than average. Climate.gov image from CPC data.
Red sun in morning
As always, the world’s oceans have a lot going on.

July 2020 sea surface temperature departure from the 1981-2010 average. Image from Data Snapshots on Climate.gov.
Of course, we’ll note the slightly cooler-than-average water in our tropical Pacific ENSO monitoring regions. Also, though, you can see the warm tropical Atlantic, one of the major factors in NOAA’s updated Atlantic Hurricane Seasonal Outlook, which expects an “extremely active” season. Another element is our increased chance for La Niña, since La Niña conditions reduce wind shear over the tropical Atlantic. Shear, the difference between winds near the surface and high up in the atmosphere, makes it hard for hurricanes to form and grow.
It’s also hard to miss the large red area in the northeastern Pacific. This certainly caught my eye, and I reached out to our NOAA colleagues and marine heatwave experts Mike Jacox and Andy Leising to find out more. They confirmed that this is a marine heatwave, a prolonged warm water event. “This current one has been going on since early June. It’s really like this whole series of [marine] heatwaves we’ve had this spring and summer are just continuations of the 2019 event,” said Andy.
The current heatwave formed in the same location as the previous one. Andy went on to say “our current idea is that it’s very likely there is considerable sub-surface heat out there left over from previous heatwaves, which makes initiation of subsequent heatwaves easier.” Check out Andy’s Blobtracker website (props for an excellent name!) for more info.
Walk the plank
What’s with all the nautical nonsense in this post? I recently returned from a sailboat trip through the mid-Atlantic Intracoastal waterway, so I have water on my mind even more than usual! Thanks for staying on board with us on the good ship ENSO.
Calm July morning on the Alligator River, NC. Photo by Emily Becker.
Comments
Thank you
Knots
Thank you
Perspectivas El Niño
RE: Perspectivas El Niño
Hello Manuel,
You are free to share your perspectives of El Nino in the comment section, provided that they abide by our comment policy of posting appropriate, on-topic content.
The current 60% chance of La Niña
RE: The current 60% chance of La Niña
Not exactly sure of the first question, but the 60% chance of La Nina factors in the models, but also initial condition and various statistical techniques. In the US, impacts from La Nina typically appear during the winter and early spring, so other than potential impacts on the already active hurricane season, other fall impacts from a potential La Nina would likely be minimal.
RE: The current 60% chance of La Niña
RE: The Current 60% Chance Of La Niña
Jet stream
RE: Jet stream
Great question. We normally look towards the winter season for the most consistent impacts on the Jet Stream across North America as that is when La Nina's tend to peak. However, there could be impacts during late fall as well. The difficult part is parsing out what is influencing what!
Of course, even having a La NIna doesn't mean that the jet stream stays in one shape an entire season. So that's where the importance of shorter term forecasts come into play.
Impact on weather in west europe
RE: Impact on weather in west europe
Here is our article on the global impacts. The signals over Europe are hard to tell.
https://www.climate.gov/news-features/featured-images/global-impacts-el…
Here is what the UK Met Office has to say. https://www.metoffice.gov.uk/research/climate/seasonal-to-decadal/gpc-o…
Comments have been disabled on this article