Betting on Climate Predictions
Pretend someone is willing to bet you $50 that El Niño will not occur. Before you jump at it, you might want to know what the chances of El Niño are, right? So you then look up your favorite model prediction and discover there is a 90% chance of El Niño. The odds are in your favor. You go for it and take the bet.
But something happens and you lose. El Niño doesn’t occur. Oh the horror! Does that mean the model is totally useless? After all it forecasted a 90% percent chance of an El Niño and it didn’t happen. You might think that means the model was awful and next time you may not trust your money with such a prediction.
These sorts of bets occur all the time. And probabilistic forecasts (models that tell you there is a certain percentage (%) chance of an outcome) are becoming more popular. An example is FiveThirtyEight’s election and sports predictions.
But, despite their popularity, it is easy to misunderstand what these models are telling you. Normally, we like to think that a prediction is either “right” or “wrong.” However, there is value in such probabilistic models even when they appear to be flat-out “wrong.”
Let’s look more closely at your bet. There was a 90% chance of El Niño. That means there was a 10% chance of no El Niño. Phrased another way, it means that given similar starting conditions, 1 in 10 times El Niño won’t develop at all. Unluckily for you, the 1 non-El Niño time appeared on the very first try!
Maybe if you had hung in there and kept making bets, the next 9 times would all have been El Niños (1). You would have won $50 x 9 = $450! A nice chunk of change: that is why it makes sense to play a long game. But if you only played the game once, becoming discouraged in that first attempt, you would not have been able to take advantage of such a model because you might have thought the model was flat out “wrong.”
Illustration by Emily Greenhalgh, NOAA Climate.gov. No resemblance to the author—or implication that she gambles—intended.
This can work the other way too. Say, in that very first turn, you won! There was a 9 in 10 chance of El Niño and then El Niño occurred. You assume this is a great model that is “right!” However, even that confidence is premature; in this one try, you just happened to be in that 9 in 10 moment. You very well could have been in the other category though it was less likely.
In fact, if the model is reliable 1 of the 10 times must result in no El Niño (we don’t know when it will occur). It might seem strange, but a model is slightly unreliable if it forecasts a 90% chance of a certain outcome occurring and that observed outcome actually happens 100% of the time (or any % other than 90%).
In a reliable model, the forecast probability should equal the historical probability over a long observational record
More simply: if you are flipping a coin, you would forecast that over a lot of coin flips, you would flip 50% heads and 50% tails. This is your prediction model: you expect the coin is equally weighted on each side and so there is a 1 in 2 chance of heads or tails. If the coin was heads in the very first coin flip, you don’t then assume your model is right or wrong. You assume that you haven’t flipped the coin enough to see whether your model is reliable. Over many flips (or long history), you should observe an outcome that is close to 50% heads and 50% tails.
Sometimes we show how good a probabilistic model is in a reliability diagram. We look at a longer period of time (30 years of past forecasts, or hindcasts) and ask how good the model was in predicting the chance of El Niño. Now keep in mind, as Tony has described previously, there are three possible outcomes in ENSO outlooks: a % chance of El Niño, La Niña, and Neutral. Here is a reliability diagram for 6-month predictions from the CFSv2 model showing the reliability of probabilities of El Niño (red line that is labeled “above”) and for La Niña (blue line that is labeled “below”):
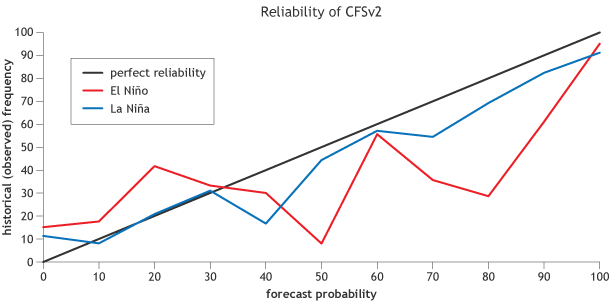
Reliability diagram for 6-month lead predictions from the NCEP CFSv2 model of the Nino-3.4 region of the tropical Pacific, which is used to classify ENSO events. The red curve shows the reliability for the model's El Niño predicitons, the blue curve shows the reliability for La Niña predictions, and the black diagonal line shows what the graph would look like if the model were perfectly reliable. Probability bins are 10% wide, except for the top and bottom, which are 5% wide. Figure courtesy of Michael Tippett (Columbia) and modified by Fiona Martin for Climate.gov.
The straight, black diagonal line shows the result for an ideal model with perfect reliability (the forecasted chance = historical chance in observations). What this figure shows us is that CFSv2 provides “overconfident” predictions 6 months out (2). That is, when it forecasts a 90% chance of El Niño, El Niño is actually observed about 60% of the time (red line). The models generally become more reliable (closer to the black diagonal line) for predictions made closer to the time the forecast is made (e.g. lead-0).
Probabilistic forecasts might seem wishy-washy at first glance. Isn’t it just a way to cover one’s backside if a prediction is “wrong?” However, a single forecast is not enough to tell you whether your prediction is “good” or “bad.” It’s over the long haul, when making bets on probabilities can pay off.
Footnotes
(1) Odds are good that the next 9 times would not have all been El Niños because the system doesn’t remember whether or not the first time was an El Niño. It requires a longer period of time to make sure your bet fully paid off (and assumes a reliable model). The reason for this is that randomness dominates in shorter records. You can envision this randomness occurs when you flip a coin. It is not surprising to see a run of consecutive heads or tails: H – T – H – H – H – T. Over a longer period of time with more coin flips, the net outcome will occur closer to 50%, but in a shorter number of flips the coin and model might seem unreliable and will often will deviate from 50% in either direction.
(2) Note that this figure has some jagged curves… this is a reflection of the lower number of cases in some bins. If we had, say 100 years of past predictions, then we would have a better estimate how reliable the model is (see footnote #1). Also, this is showing just the “raw” data from CFSv2. At NOAA CPC, we statistically correct the raw model output from CFSv2 (using hindcasts of CFSv2 data) in order to obtain predictions with better reliability. Despite the correction, CFSv2 remains slightly overconfident for long lead forecasts. Here is an example of what a statistically adjusted CFSv2 reliability diagram looks like (same as the figure above except adjusted using the statistical correction in Barnston and Tippett, 2013):
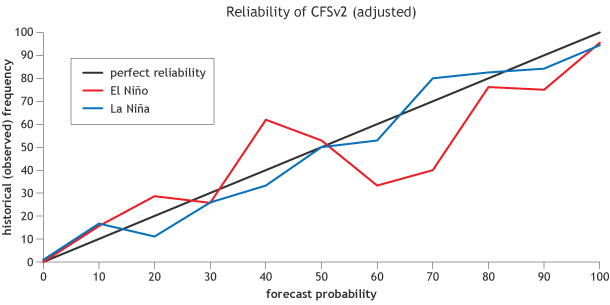
Reliability diagram for “statistically corrected,” 6-month lead predictions from the NCEP CFSv2 model of the Nino-3.4 SST region, which is used to classify ENSO events. The red curve shows the reliability for El Niño predictions, the blue curve shows the reliability for La Niña predictions, the black diagonal line shows what a perfectly reliable model would look like. Probability bins are 10% wide, except for the top and bottom, which are 5% wide. Figure courtesy of Michael Tippett (Columbia) and modified by Fiona Martin for Climate.gov.
References
Barnston, A.G, and M. K. Tippett, 2013: Predictions of Nino3.4 SST in CFSv1 and CFSv2: a diagnostic comparison. Clim. Dynam., 41, 1615-1633. (open access)
Comments
Thanks for the great article!
RE: Thanks for the great article!
Is La Nina more predictable than El Nino?
RE: Is La Nina more predictable than El Nino?
There are many measures of prediction skill and "reliability" is only one of them. At this point there is no evidence that we're aware of that says that La Nina is more predictable than El Nino. However, in this *one model* the reliability score does seem to suggest probabilities assigned during La Nina are better than that of El Nino. Sample size could play a role as well. And in any case, this result doesn't necessarily translate to other models.
You're other idea is interesting and not one that we've ever looked at. Agreed it would make an interesting figure, possibly something we'll look at in the future.
This was a very informative
RE: This was a very informative
Thanks for the suggestion. It's something we'll certainly consider doing. At this point, the atmospheric fields are not reflective of El Nino, and is a significant reason why we have yet to declare that El Nino has arrived.
reliability
RE: reliability
Well, I'm not the crazy one :-) I agree that we could have played up your point a bit more in the article, but we decided to keep the math simple as possible. Footnotes (1) and (2) describe the point you're making here which is that 10 is way too small of a sample to obtain proper reliability statistics. Ideally, we'd have thousands of samples. Even the reliability figures that we show you which are based on 30 years of model hindcasts are not long enough and have some degree of error associated with the estimate. Thanks for weighing in and reinforcing this point-- complete with a great joke!
AGEN JUDI BOLA TERPERCAYA
weather
Comments have been disabled on this article