ENSO and… Antarctica! And penguins!
Here at the ENSO Blog we’ve explored the effects of El Niño and La Niña on Australia, South America, Africa, India, and the northern Pacific and Atlantic Oceans. Our posts about North American impacts are too many to list—check out the index page to see some of those. We’ve even visited the Arctic! Today, we’ll add the fifth-largest continent, a vast, ice-covered disc at the bottom of the world, surrounded by a roaring ocean.
Keep going south until you’re going north
Antarctica is about as close to being on another planet as you can get while still on Earth. Its 5.5 million square miles have been covered in ice for 35 million years, the average summer (December–February) temperature at the south pole is -18°F, and the ice sheet covering the land averages 1 mile thick and contains over 70% of the world’s fresh water. Antarctica is entirely surrounded by the Southern Ocean, which allows the west-to-east winds to tear along unimpeded, whipping up tremendous waves and storms.
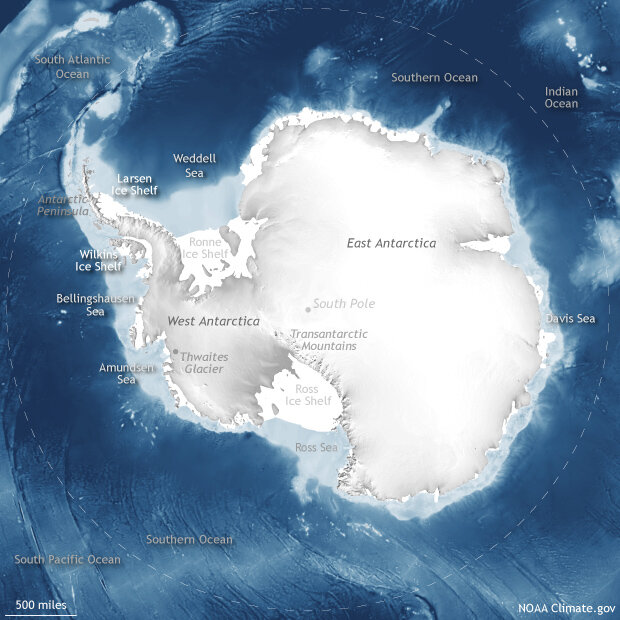
Geographers divide Antarctica into three regions: East Antarctica, West Antarctica, and the Antarctic Peninsula. The Transantarctic Mountains separate the eastern and western parts of the continent. Ice shelves fringe the continent, the two largest being the Ronne and the Ross. Among the nearby seas are the Amundsen, Bellinghausen, Davis, Ross, and Weddell, and Antarctica is surrounded by the vast Southern Ocean.
The continent is surrounded by seasonally varying sea ice. Sea ice extent can reach 7 million square miles at the maximum in September, shrinking to around 1 million square miles in February or March. Along the edge of the continent, numerous glacier-fed ice shelves are grounded below sea level, with floating tongues that reach out as far as the balance between gravity and buoyancy allows.
When the balance fails, portions of the shelf break off into icebergs, a natural process known as calving. In recent decades, some shelves have disintegrated rapidly. These processes don’t directly contribute to sea level since the ice was already floating in the ocean. But grounded ice shelves slow down the free flow of interior glaciers into the ocean, keeping their glacial contribution to sea level rise in check. Also, grounded ice can contribute to sea level rise when it is melted by warmer ocean water from below. For more detail on ice shelves and glacial acceleration, check out this great climate.gov overview of Antarctic ice.
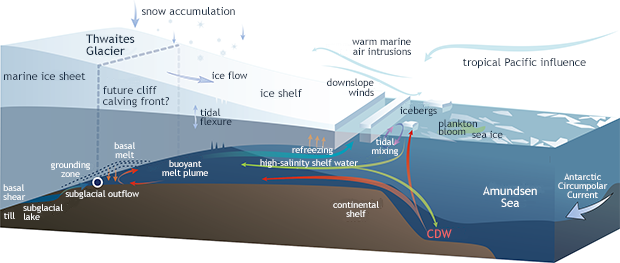
Glacier-fed ice shelves are complex systems affected by multiple factors: gravity pulling on the glacier, water buoying the ice shelf, air and water temperatures, winds, storms, snow accumulation and so on. Atmospheric and oceanic circulation patterns can drive these events, and ice shelf responses can change the outcome. This schematic of Thwaites Glacier in West Antarctica shows some of the processes affecting glacier flow and ice shelf calving. Image from Scambos et al. 2017.
Scientists are acutely interested in how different climate patterns—such as ENSO—and global warming are affecting the Antarctic ice shelves, because of the potential contribution to sea level rise. And because it’s a fascinatingly complex system unlike anything else on Earth!
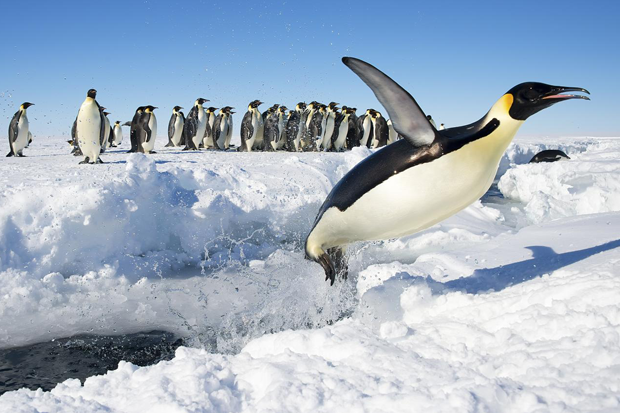
Also, penguins live here
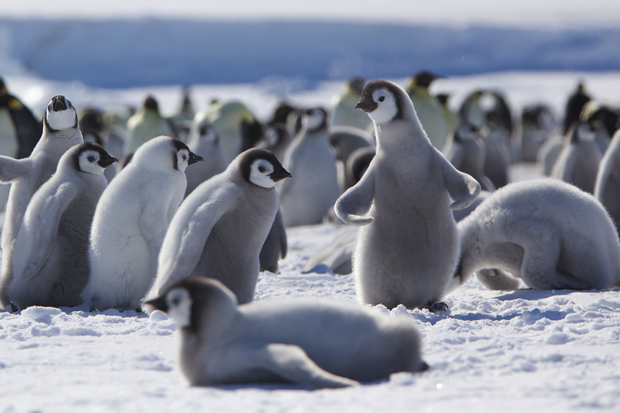
Emperor penguin chicks on Snow Hill Island, Antarctic Peninsula, on November 16, 2009. Image by Flickr user Ian Duffy, used under a Creative Commons license.
Remote impacts of El Niño and La Niña—effects on temperature, precipitation, and other weather and climate—are called teleconnections. On average, the very warm waters of the far western Pacific and Indonesia produce a huge amount of warm, moist rising air. This convection is a sort of engine for global atmospheric circulation, as the rising air branches out to the north and south at higher levels in the atmosphere. El Niño’s warmer-than-average central/eastern Pacific surface moves this engine eastward, weakening the Walker circulation and causing a cascade of global impacts. La Niña, on the other hand, strengthens the convection over Indonesia even more than normal.
Antarctica is difficult to study, as its remoteness means we don’t have as many recorded observations of the climate there as we do in more accessible parts of the world. However, by the mid-1970s, scientists had enough evidence that El Niño had a teleconnection impact on Antarctica that they undertook several studies to figure out how it works. (I relied on a 2004 paper by John Turner, “El Niño and Antarctica,” for the background in this post.)
These studies revealed that El Niño’s changes to tropical atmospheric circulation lead to a large-scale atmospheric wave, an alternating pattern of high-pressure and low-pressure areas, that extends from the tropical Pacific southward to Antarctica. These atmospheric waves, called Rossby waves, are also how ENSO and other climate patterns affect Northern Hemisphere weather and climate. The average atmospheric wave train in the southern Pacific during El Niño is higher-than-average pressure near the equator, lower-than-average east of New Zealand, and higher-than-average pressure over the Southern Ocean near Antarctica.
Meanwhile, there’s a region of low pressure off the coast of West Antarctica that’s always there; it’s called the Amundsen Sea Low. The effect of the El Niño teleconnection, then, is that the Amundsen Sea Low is weaker than average (pressure is higher than normal). On the other hand, during La Niña, the Amundsen Sea Low is stronger than average (pressure even lower than normal).
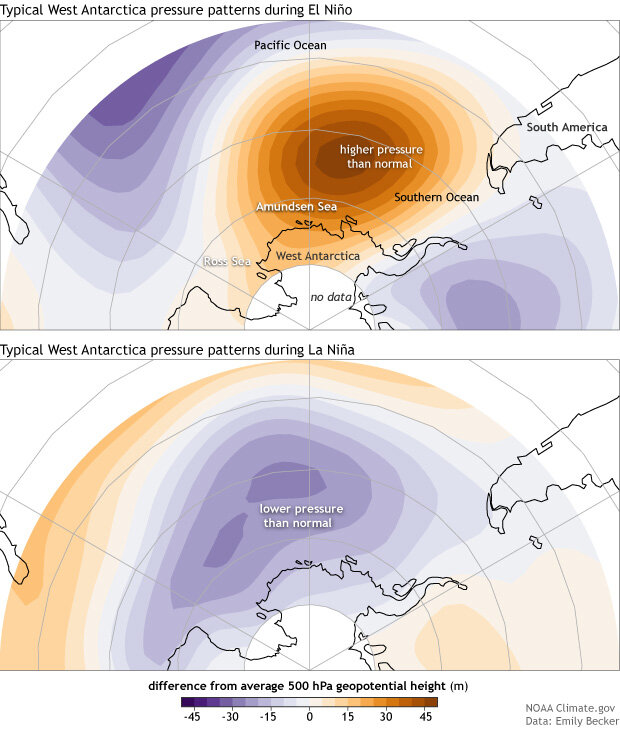
Average June–August anomaly in the height of the 500 hPa layer in the atmosphere during El Niño (top) and La Niña, based on historical El Niño and La Niña events. Higher heights show higher atmospheric pressure; lower heights show lower pressure. Figure by Emily Becker and climate.gov using NCEP-NCAR Reanalysis data.
What’s that all add up to?
All this lower-than-low or higher-than-low language gets confusing, but bear with me, because it’s through its effect on the Amundsen Sea Low that ENSO affects Antarctica.
A recent study by a team at University of California San Diego, led by Fernando Paolo, examined what these ENSO-related pressure patterns mean for the west Antarctic ice shelves using observations from satellites. They noted that the overall mass of the ice shelves is governed by how much snow falls and how much melting occurs at the base of the ice shelf from upwelling deep ocean water.
When the pressure over the Amundsen Sea is higher than normal—as is the case during El Niño—the near-surface winds are more northwest-to-southeast. This transports warmer, moister air from the ocean to west Antarctica, resulting in more snow. But also, this wind direction tends to cause more upwelling from the Circumpolar Deep Water—a middle-depth water layer that is warm relative to the surface waters. Upwelling of the Circumpolar Deep Water melts and thins the deeper, thicker ice shelves from below. La Niña’s deeper Amundsen Sea Low leads to more southeast-to-northwest winds, causing the opposite effects—drier, colder air and less snow, but also less warm water upwelling. (I got most of the details on the Amundsen Sea Low from this Bulletin of the American Meteorological Society article.)
Penguin break!
Emperor penguins at Gould Bay, Antarctica, on December 3, 2013. Image by Flickr user Christopher Michel, used under a Creative Commons license.
More snow + more melting = ?
The study by Dr. Paolo and his team aimed to find out which El Niño-related effect—more snow, or more melting—had the greatest impact on the mass of the West Antarctica ice shelves. Snow eventually compacts into ice, increasing ice shelf mass. However, they found that the melting from below caused by increased upwelling of Circumpolar Deep Water was the dominant effect. Ultimately, El Niño tends to decrease the mass of West Antarctica’s ice shelves. La Niña appears to have the opposite effect, with less melting of the underwater ice.
Now’s the part of the blog post where I remind readers that nature is highly variable, and while ENSO has a clear impact on West Antarctica, every event is different, and there are a lot of things going on at once—including climate change. Scientists are still learning about Antarctica’s climate, and we have a ways to go before we have it all figured out.
There’s a La Niña right now, right?
Right! Thanks for reminding me. It turns out that the pressure pattern this past austral winter (June–August 2020), when the current La Niña was beginning, looks quite a bit like we’d expect during La Niña, with the Amundsen Sea Low deeper than average (lower pressure than normal). All other climate factors being equal, this would favor ice shelf stability, with less warm upwelling to undermine the region’s ice shelves.
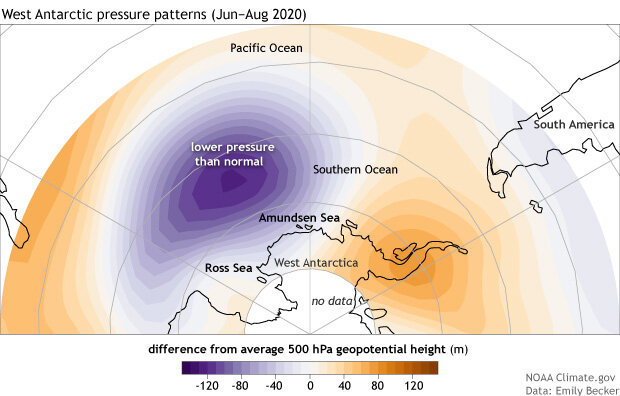
June–August 2020 anomaly in the height of the 500 hPa layer in the atmosphere. Figure by Emily Becker and climate.gov using NCEP-NCAR Reanalysis data.
I’ll be back on my regular beat in January, but thanks for traveling to the frozen South with me this month, even if just virtually!
Comments
The La Nina effect on Antarctica's sea ice extent
Thanks
Thanks for this. It's surprisingly hard to find impacts of enso on a north-south basis. Lots of info on east west, but this is the first detailed article for Antarctica that I've seen. I was very curious to know about how the pressure differences are spread across the southern ocean.
Add new comment