February and March madness: How winds miles above the Arctic may have brought wintry weather to mid-latitudes
This is a guest post by Dr. Amy Butler (@DrAHButler) who is a research scientist at the University of Colorado Cooperative Institute for Research in Environmental Sciences (CIRES) and sits within the NOAA Chemical Sciences Division (CSD). She is a returning guest author, and her research focuses on large-scale climate patterns and phenomena, such as the Arctic and Antarctic Oscillations and sudden stratospheric warmings.
Spring hasn’t come quickly enough for many of us who feel battered by the wild winter weather over the past couple of months. Multiple nor’easters brought feet of snow to the northeastern U.S., while severe cold and winter storms punished portions of western Europe. What is the cause of this meteorological madness? Readers may be surprised to know that part of the answer may be found high in the atmosphere above the Arctic in connection with a phenomenon known as the stratospheric polar vortex, which I wrote about a couple years ago on this blog.
High drama in rarefied air
This winter, on February 12, 2018, most of us probably were unaware of the compelling drama unfolding high above the Arctic. The stratospheric polar vortex, the region of west-to-east winds that circle 6 to 30 miles above the pole, (1) experienced a massive breakdown. The normally west-to-east winds suddenly slowed and switched direction completely as the stratosphere rapidly warmed more than 50 degrees F in a matter of days (see figure below). This sequence of events followed the classic progression of a sudden stratospheric warming (SSW), a type of event that occurs on average about six times per decade.
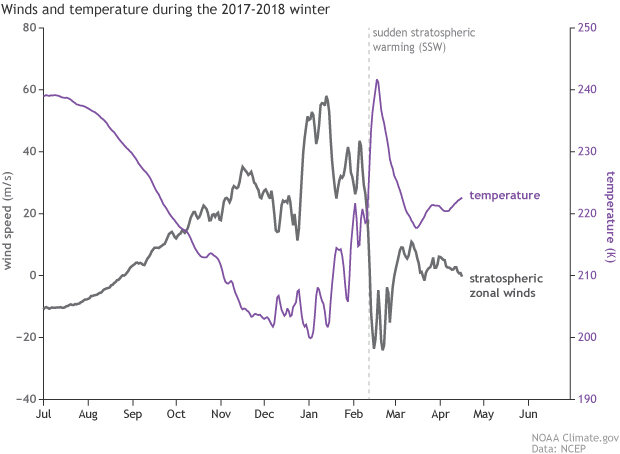
Evolution of stratospheric temperature and winds during the 2017-18 winter. The stratospheric zonal (west-to-east) winds [meters/second] at 10 hPa (about 20 miles altitude) and 60°N (grey, left y-axis), a common measure of the strength of the polar vortex, and the temperature [kelvins] (purple, right y-axis) at the same location. The vertical line indicates the SSW in February 2018. In the Northern Hemisphere, these west-to-east winds typically form in late August, strengthen through January, and weaken and reverse in late spring as the sun returns to the polar region. SSWs occur when these winds dip below 0 meters/second, as in February 2018.
Why did this sudden stratospheric warming occur? And more importantly (for blog purposes, at least), why should you care? Let’s start with the first why. Under the right conditions in winter (2), large atmospheric waves (more than 1000 miles across) travel from the lower atmosphere into the stratosphere. These waves break in the stratosphere, like ocean waves on a beach, transferring a tremendous amount of energy to the atmosphere.
The effect is to slow down the winds of the polar vortex (sometimes splitting it into two smaller vortices). As the winds slow, air sinks and rapidly warms while the stratospheric air is compressed. This sequence of events is exactly what happened this past February—in fact, we experienced a record-breaking movement of large-scale waves into the stratosphere (3) (see figure below).
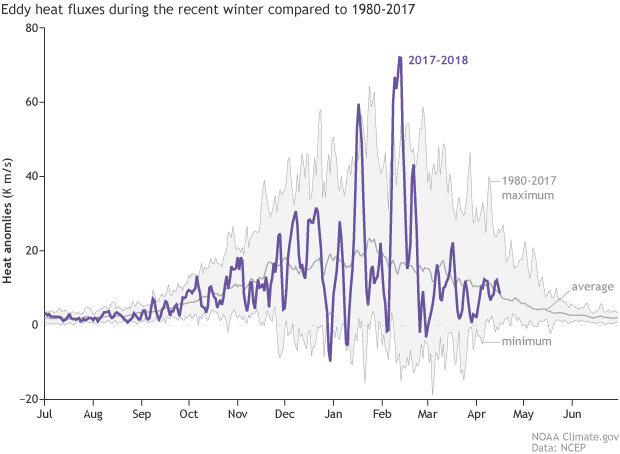
A measure of the tropospheric waves entering the lower stratosphere called eddy heat fluxes. The purple line shows the values in 2017/18, whereas the gray lines show the 1980-2017 maximum, average, and minimum. The values seen in early February broke the all-time record for the 1980-2017 period. Data are from the NCEP CFSR reanalysis.
Now let’s address why should you care about these changes in the winds miles above the Arctic. It turns out they can cause persistent and potentially predictable changes in surface weather that can last for days to weeks over the entire Northern Hemisphere (Sigmond et al. 2013). Though there can be significant differences in regional surface impacts between one SSW event and another, the typical pattern includes changes in sea level pressure resembling the negative phase of the North Atlantic Oscillation (NAO)/Arctic Oscillation (AO), (representing a southward shift in the Atlantic storm track), wetter than average conditions for much of Europe, cold air outbreaks throughout the mid-latitudes, and warmer than average conditions in eastern Canada and subtropical Asia (see figure below, left panel).
The temperature pattern in the weeks following this year’s SSW event (right panel) looked very similar to the average pattern following these events, particularly over Europe and Asia. Within a couple of weeks of the event, winter weather came back with a vengeance to Europe, in the form of several severe winter storms that battered the United Kingdom and most of western Europe, bringing snow as far south as Rome.
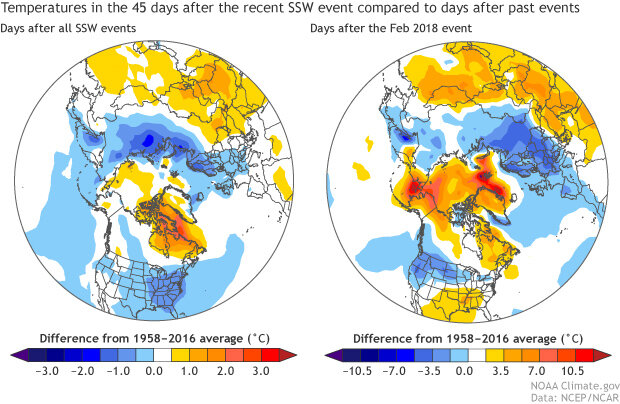
The near-surface temperature deviations from normal [°C], relative to a 1958-2016 base period, averaged over the 45-day period following (left) all observed SSWs and (right) the Feb 2018 SSW. Data are from the NCEP-NCAR reanalysis. See also Butler et al. (2017).
Over the eastern United States, the effects were delayed. In fact for most of February, the East Coast basked in warm spring-like temperatures—due in part to the influences of the Madden-Julian Oscillation and La Niña. However, as the North Atlantic/Arctic Oscillation predictably veered towards a negative phase (see below), the Atlantic jet stream shifted southward, and a blocking pattern south of Greenland developed. This pattern can be conducive for driving nor’easters towards the east coast of the USA (4), which soon became evident following four nor’easters in a matter of weeks. The effect was several feet of snow in northeastern states, and persistent cold and snowy weather along the East Coast throughout March.
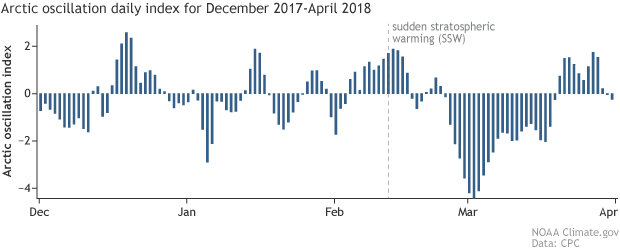
The Arctic Oscillation (AO) daily index for December 2017- April 2018. The Feb 12th SSW event is marked with a vertical black line. The North Atlantic Oscillation (NAO) index exhibited similar behavior as the AO index during this period.
The forecast challenge
How well did we forecast this sudden stratospheric warming event? Because the breakdown of the stratospheric polar vortex is driven by atmospheric waves, which are related to short-term weather fluctuations, we can’t forecast these events more than 10-15 days in advance with much skill. However, once the forecast models begin to predict the occurrence of a sudden stratospheric warming with confidence, the effects of the event on monthly and seasonal forecasts can be striking.
Although more careful analysis is needed, at first glance, the February 2018 event appears to be a classic case of the striking SSW effects on monthly forecasts, particularly for Europe. Several forecasting models started picking up on this event during the last few days of January, about 12-13 days before the SSW occurred. The forecasts after the SSW was included in the models were much colder for Europe, and these forecasts turned out to be more accurate (see figure below).
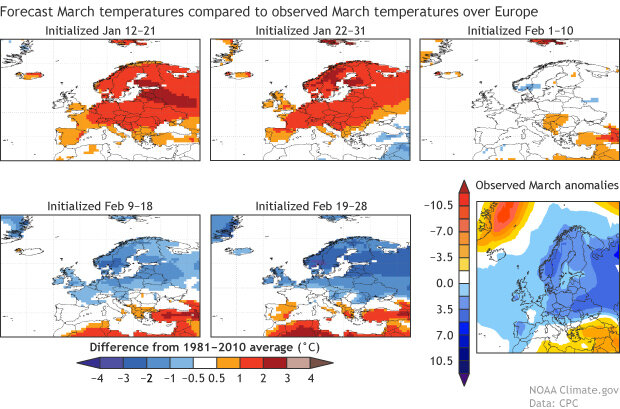
Forecasts of March near-surface air temperature departures from average (°C) (relative to a 1981-2010 base period) over Europe, for CFSv2 forecasts initialized in mid-January (top left) through mid-February (bottom center). The actual observed March near-surface temperature departures from average are shown in the bottom right. The forecasts can be found here: http://www.cpc.ncep.noaa.gov/products/CFSv2/CFSv2_body.html.
Although we generally cannot predict the exact start of a sudden stratospheric warming beyond 10-15 days, research has shown that there are factors that may modify the likelihood of a SSW occurring within a month or season, which provides some hope for monthly and seasonal forecasts. Factors like ENSO, the MJO, sea ice, snow cover, and oscillations in the tropical stratospheric winds have all been found to influence the strength of the polar vortex. These relationships may allow us to predict whether a SSW, and its impacts, are more likely to occur, even before the forecast models hone in on the exact date of the SSW.
Of course, over the course of an entire season the relative importance of SSW effects will depend on other climate patterns. Over North America, ENSO tends to be the biggest, most predictable player over the course of a season (whether an SSW occurs or not), whereas over Europe, a SSW may determine whether winter is mild or harsh (Polvani et al. 2017). For example, La Niña winters tend towards a stronger polar vortex and the positive phase of the NAO, but if the polar vortex breaks down (which it’s done many times during La Niña winters; Butler & Polvani 2011) it will push the climate towards a negative NAO pattern, and the two effects tend to cancel over the season.
The average pattern of all the La Niña winters for which an SSW occurred (see below) shows some similarities in certain regions to what happened this winter, but it’s clear that there were other factors at play (for example, note the exceptional warmth in the Bering Strait near Alaska). Understanding how these different climate phenomena interact, how they are simulated in models, and how they can be used for sub-seasonal to seasonal forecasting is currently a major focus of research.
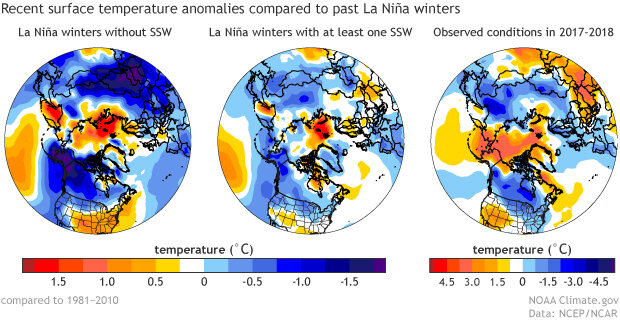
The near-surface temperature anomalies [degrees C], relative to a 1981-2010 base period from NCEP-NCAR reanalysis, averaged over November-March for (left) La Niña winters without any SSWs, (middle) La Niña winters with at least one SSW, and (right) observed conditions in 2017-18. Figure adapted from Polvani et al. (2017) with the use of ERSSTv5 ENSO classifications.
Lead editor: Nat Johnson
Footnotes
- The term “polar vortex” has become a colloquialism frequently used in the popular media to refer to the “tropospheric polar vortex” or the tropospheric jet stream (the troposphere is the lowest layer of the atmosphere between earth’s surface and the stratosphere). Among climate scientists, the “polar vortex” is usually used to refer to the “stratospheric polar vortex,” which occurs in both hemispheres during winter. While the tropospheric polar vortex is sometimes (not always!) connected to the stratospheric polar vortex (Waugh et al. 2017), their impacts on surface weather generally involve different physical processes.
- What exactly these conditions are in the real world is still an area of active research, but these waves can only propagate into winds that are westerly (from west to east) and below some critical wind speed (the winds can’t be too fast). See Charney & Drazin (1961) for a theoretical look at why this holds true.
- The timing of these waves, which also transport heat towards the pole, was at least suggestive of a relationship with both a large amplitude Madden-Julian Oscillation event and excessive warmth in the Arctic region.
- See for example, Northeast Snowstorms Volume 1 and Volume 2, by Paul Kocin and Louis Uccellini.
References
Butler, A.H. & Polvani, L.M., 2011. El Niño, La Niña, and stratospheric sudden warmings: A reevaluation in light of the observational record. Geophysical Research Letters, 38(13). doi: 10.1029/2011GL048084.
Butler, A.H., Sjoberg, J.P., Seidel, D.J. & Rosenlof, K.H., 2017. A sudden stratospheric warming compendium. Earth System Science Data, 9(1), 63–76. doi: 10.5194/essd-9-63-2017.
Charney, J.G. & Drazin, P.G., 1961. Propagation of planetary-scale disturbances from the lower into the upper atmosphere. Journal of Geophysical Research, 66(1), 83–109. doi: 10.1029/JZ066i001p00083.
Polvani, L.M., Sun, L., Butler, A.H., Richter, J.H. & Deser, C., 2017. Distinguishing Stratospheric Sudden Warmings from ENSO as Key Drivers of Wintertime Climate Variability over the North Atlantic and Eurasia. Journal of Climate, 30(6), 1959–1969. doi: 10.1175/JCLI-D-16-0277.1.
Sigmond, M., Scinocca, J.F., Kharin, V. V. & Shepherd, T.G., 2013. Enhanced seasonal forecast skill following stratospheric sudden warmings. Nature Geoscience, 6(2), 98–102. doi: 10.1038/ngeo1698.
Waugh, D.W., Sobel, A.H. & Polvani, L.M., 2017. What is the polar vortex, and how does it influence weather? Bulletin of the American Meteorological Society. doi: 10.1175/BAMS-D-15-00212.1.
Comments
thank you for the information
hi great blog, but have you
Thank you for the Informations
Add new comment