How does NOAA see the 2024 Atlantic hurricane season shaping up?
This is a guest post by Matthew Rosencrans, who is the lead hurricane season forecaster at the NOAA Climate Prediction Center.
Spring has turned to summer, which means that allergies have mostly let go of their hold over our collective sinuses (apologies to those still suffering), sunscreen lathering is again a daily ritual, and many people grab their chairs and blankets and head to the beach. However, this is also when trouble can start brewing in the tropics, and so at this same time every year, forecasters across NOAA (1) turn their attention to the upcoming Atlantic hurricane season. Each May, NOAA issues their Atlantic Hurricane Season Outlook for the number of tropical storms and hurricanes we can expect in the upcoming summer and fall.
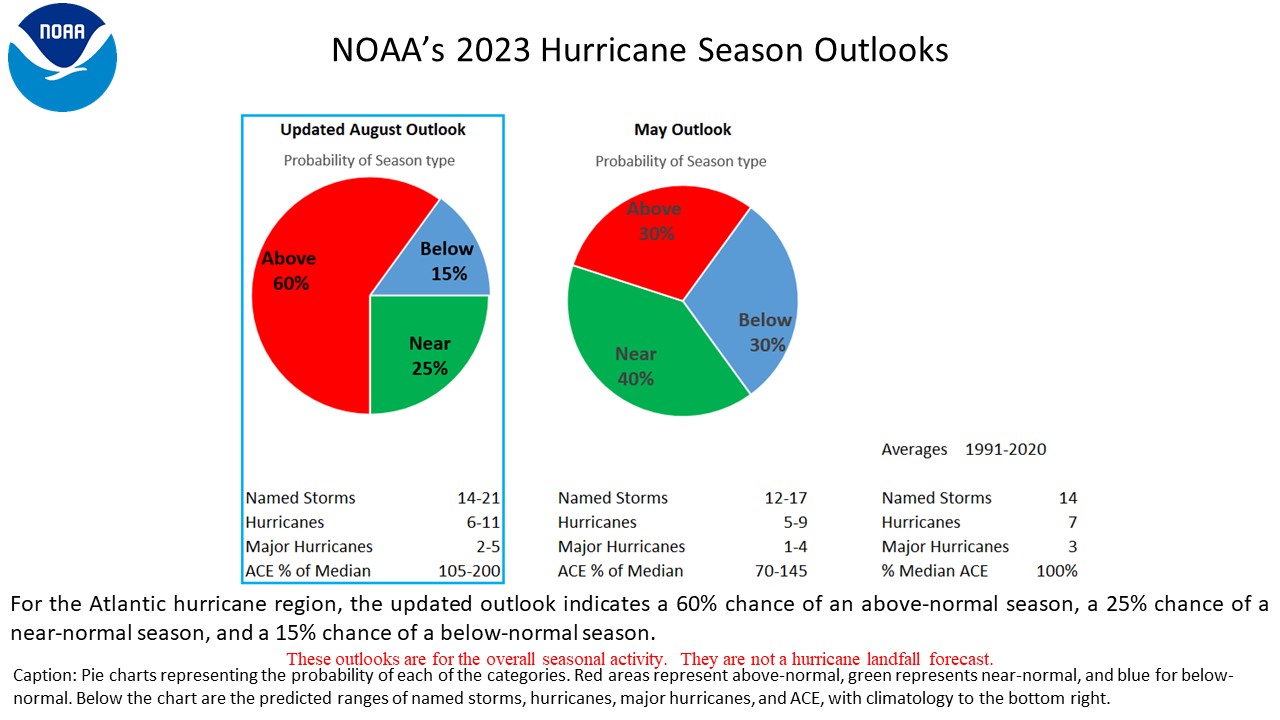
This year, NOAA predicts a very high likelihood (85% chance) of an above-normal Atlantic hurricane season (2), with 17-25 named storms (average is 14), 8-13 hurricanes (average is 7), and 4-7 major hurricanes (average is 3) (3). Why is NOAA so confident that we will have an active Atlantic hurricane season? We’ll lay it all out for you here (spoiler alert: we wouldn’t neglect ENSO on the ENSO Blog!).
The ENSO seesaw
The first critical piece in the hurricane forecast playground is, you guessed it, the El Niño-Southern Oscillation (ENSO). As discussed previously on the blog (see here and here), ENSO has a large influence on the number of tropical storms and hurricanes in both the Atlantic and the Pacific. The hurricane impacts of ENSO are like a seesaw between the Pacific and Atlantic oceans, strengthening hurricane activity in one region while weakening it in the other. When El Niño is driving, it tends to suppress hurricane activity in the Atlantic while amping it up in the eastern Pacific. La Niña has the opposite effect, usually increasing activity in the Atlantic and decreasing it in the eastern Pacific.
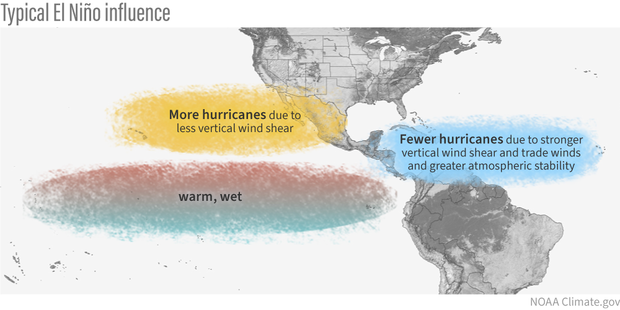
Typical influence of El Niño on Pacific and Atlantic seasonal hurricane activity. Map by NOAA Climate.gov, based on originals by Gerry Bell.
With La Niña likely developing by the peak of this year’s hurricane season, let’s dig into La Niña’s influence a bit more. La Niña’s main influence on hurricanes is primarily through changes in how the tropical winds change in speed and direction from the surface up to about 7 miles above the ground. We call this change in wind with increasing height the vertical wind shear, and strong vertical wind shear can rip a developing hurricane apart, or even prevent it from forming. A mature La Niña can reduce the wind shear over the Atlantic Basin, primarily over the western half of the tropical Atlantic, which creates an environment more favorable for storms to form, organize, and become more intense.
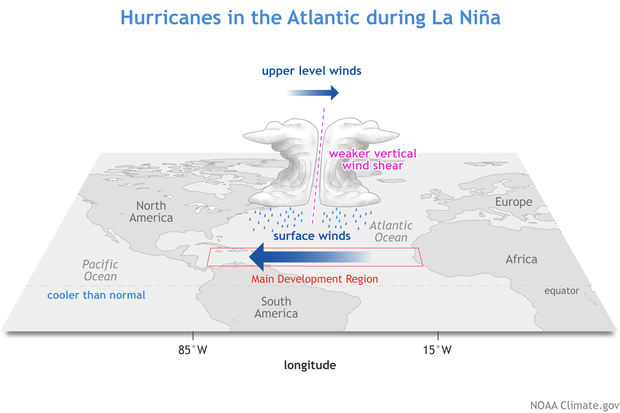
During a La Niña-influenced hurricane season, prevailing winds are weaker than average, especially the upper-level westerlies. Hurricanes experience less vertical wind shear. NOAA Climate.gov diagram.
How does La Niña alter the pattern of vertical wind shear across the tropics? As this blog has discussed before, La Niña enhances the Walker circulation, with more rising air and rainfall over the western Pacific and Indonesia and more sinking air with reduced rainfall across the eastern half of the equatorial Pacific. In the upper atmosphere, these conditions produce an amplified “trough” of low pressure over the subtropical eastern Pacific in the area to the north of the suppressed rainfall, and a downstream “ridge” of high pressure over the Caribbean Sea and western tropical Atlantic. Think of the ripple effect from a rock hitting the water and you can get the general idea.
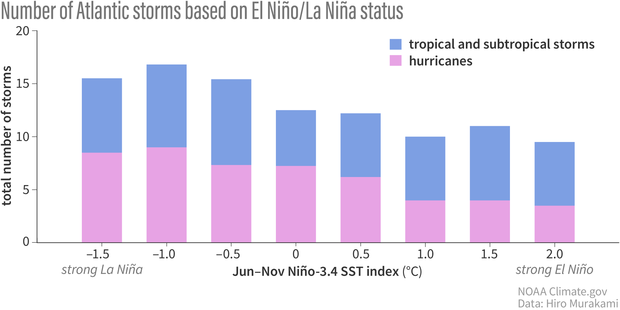
The number of Atlantic hurricanes and tropical/subtropical storms tends to increase under La Niña conditions but decrease under El Niño conditions. The bars present the average number Atlantic hurricanes and tropical/subtropical storms sorted by El Niño/La Niña status, as determined by the June-November Niño-3.4 sea surface temperature index values over the 1980-2023 period. Atlantic tropical storm and hurricane data provided by Hiro Murakami and determined from the IBTrACS dataset. NOAA Climate.gov image, based on analysis by Nat Johnson.
That anomalous upper-level ridge in the tropical Atlantic is associated with weaker upper- and lower-level winds, both of which reduce the vertical wind shear and can increase hurricane activity (4).
Changes in wind shear are not the only effect of ENSO on hurricanes. La Niña also favors increased Atlantic hurricane activity by decreasing the amount of subsidence (sinking motion) over the Atlantic and decreasing the atmospheric stability. That means that it is easier for warm, moist air at the Atlantic surface to rise high in the atmosphere, forming the clouds and rainfall that allow tropical storms to develop and intensify.
Tropical Atlantic spring riders
ENSO isn’t the only piece at play. The sea surface temperatures in the Main Development Region, the region of the tropical Atlantic between 10°N and 25°N, where most Atlantic tropical storms form, also are a major factor in this year’s Atlantic Hurricane Season Outlook. The ocean temperatures in the Atlantic Basin are at record-warm levels. In fact, the temperatures in May were closer to what we would expect in late August, when we are approaching the traditional peak of the hurricane season! Approximately 90% of Atlantic tropical storm and hurricane activity happens during August through October. Given this unusual Atlantic warmth, hurricane activity could ramp up quickly, so it’s never too early to prepare.
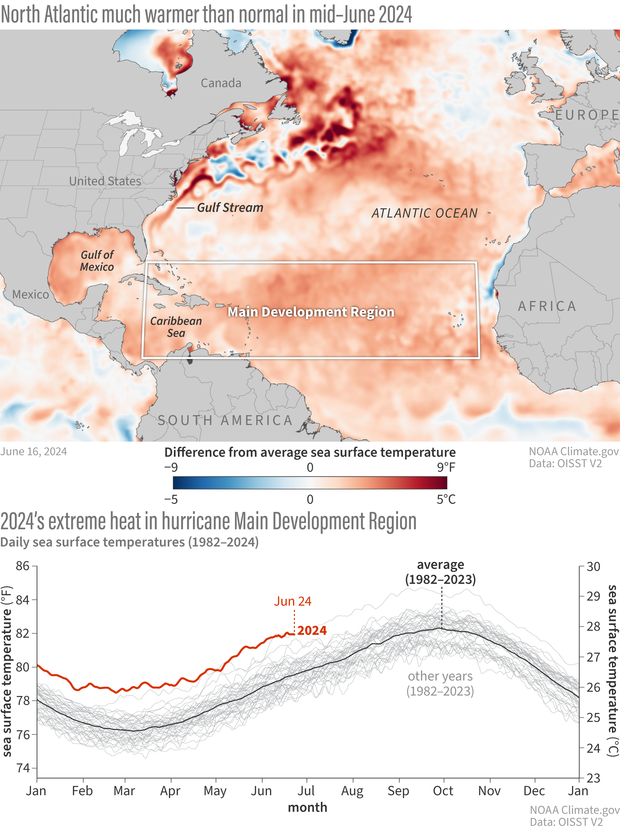
The Main Development Region for Atlantic hurricanes has been at record warm levels in 2024. (Top) Map showing where sea surface temperatures across the North Atlantic on June 16, 2024, were warmer (red) or cooler (blue) than the 1971-2000 average (white). (Bottom) The daily time evolution of Atlantic sea surface temperatures in the hurricane Main Development Region (10–25°N, 80–20°W) in 2024 (red) compared with all other years from 1982-2023 (grey) and the 1982-2023 average (black). Surface temperatures in the Main Development Region during May and June of 2024 were comparable to what we typically experience in July and August when we approach the peak of the hurricane season. Image by NOAA Climate.gov, based on NOAA's OI SST V2 High Resolution Dataset.
Although the Atlantic heat this spring and early summer has been exceptional, anomalously warm conditions over this region have been common over the past few decades. Check out footnote #5 for some additional details on what may be driving the persistent Atlantic warmth.
West African swings
The final major piece of equipment on the hurricane season playground is the West African Monsoon. The West African Monsoon is a climate pattern with near-surface winds that blow southwest-to-northeast into the interior of West Africa, spreading heavy rains during the warmer months and then reversing direction in the cooler months. A stronger-than-average West African Monsoon, as expected this season, produces a westward extension of the upper-level (near 35,000 ft) easterly (from the east) winds, along with weaker easterly trade winds in the lower atmosphere.
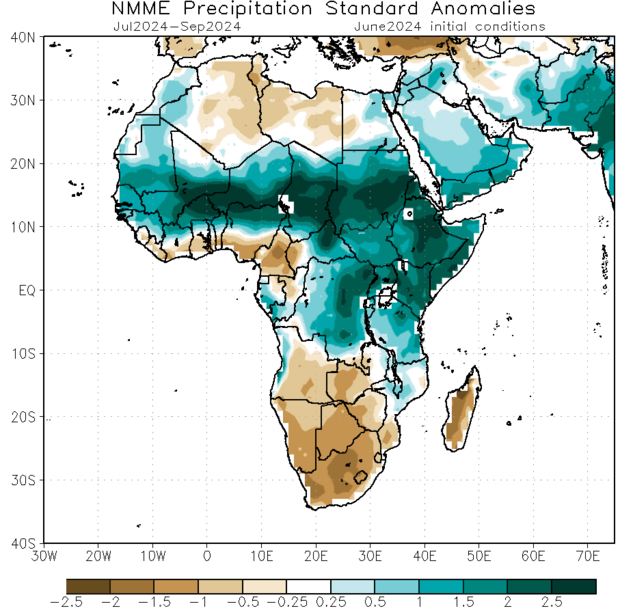
Predicted departures from average precipitation (anomalies) over Africa for the July–September 2024 period from the North American Multi-model Ensemble (NMME). Models predict a stronger-than-average West African Monsoon, which shows up as the dark green areas in West Africa between 10 and 20 degrees North. NOAA Climate.gov image, adapted from original by NOAA Climate Prediction Center's International Desk.
This wind configuration and associated moisture patterns favor the enhancement of disturbances called African easterly waves that propagate across the African continent and over the Atlantic, often forming the seeds of incipient hurricanes. Therefore, the forecast for a stronger West African Monsoon also contributes to the likelihood of an active Atlantic hurricane season.
Putting it all together
When we put together all pieces of the Atlantic hurricane season, we see a clear picture of multiple factors favoring an active season. Although the deck may seem stacked in favor of this outcome, we remind the reader that there always are wildcards (i.e., weather) that we cannot predict more than a couple of weeks in advance, and they potentially could push the Atlantic season in the other direction.
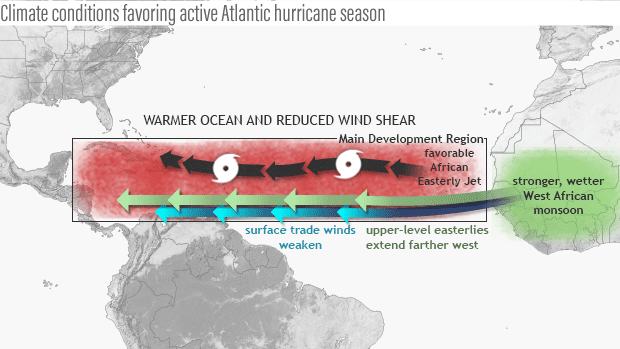
Seasonal climate patterns associated with active hurricane seasons. La Niña contributes to reduced vertical wind shear in the Main Development Region for hurricanes in this basin. Map by NOAA Climate.gov, based on originals by Gerry Bell.
That’s why the Atlantic Hurricane Season Outlook, like all of NOAA’s seasonal outlooks, are expressed as probabilities, which means no single outcome is guaranteed. Nevertheless, if you haven’t done so already, now is the time to start preparing for the upcoming hurricane season (like reviewing this great information provided our colleagues at FEMA) and keeping aware of what’s brewing over the tropics.
Lead Editor: Nat Johnson (NOAA GFDL)
Footnotes
- The team the provides guidance and ultimately produces the hurricane outlook includes scientists from the NOAA Climate Prediction Center, National Hurricane Center, Atlantic Oceanographic and Meteorological Laboratory, and Geophysical Fluid Dynamics Laboratory.
- In contrast, near- or below-normal hurricane conditions are favored over the Eastern and Central Pacific basins.
- Named storms represent all storms that achieve tropical or subtropical storm strength or higher, as determined by their maximum sustained surface wind speeds. Tropical and subtropical storms have sustained winds between 39 and 73 mph. Tropical and subtropical storms can intensify to hurricanes, which have sustained winds of 74 mph or greater. Major hurricanes are hurricanes with sustained winds of at least 111 mph (Categories 3, 4, and 5 on the Saffir-Simpson Scale).
- Conversely, over the central and eastern subtropical Pacific (the other side of the seesaw), the enhanced trough is associated with stronger upper-level winds and stronger vertical wind shear, which suppress hurricane activity. When El Niño occurs, the teeter-totter swings in the opposite direction: increased vertical wind shear tends to suppress Atlantic hurricane activity while decreased shear increases activity in the eastern and central Pacific.
-
The pronounced Atlantic warmth over the last several decades has helped to fuel a period of enhanced hurricane activity. Rising greenhouse gases have contributed to long-term warming over the Main Development Region of the Atlantic, as throughout rest of the planet, but greenhouse gas warming alone is unlikely to fully explain the pattern of warming. This amplified Atlantic warmth that has persisted since about 1995, which is often attributed to the warm phase of the so-called Atlantic Multi-Decadal Oscillation (AMO), has been the source of considerable scientific debate. (More recently, this pattern also has been called Atlantic Multidecadal Variability, or AMV, because it does not demonstrate clear oscillatory behavior.)
One perspective is that the AMO is fundamentally a pattern of natural climate variability, like ENSO but evolving over much slower, multidecadal time periods. During the cold phase of the AMO that persisted from 1971-1994, Atlantic hurricane activity was considerably less intense than in the warm AMO period that followed. Another perspective, however, is that much of the recent AMO variability is not natural but instead is primarily attributed to human activity, especially from the reduction in pollution (“anthropogenic aerosols”) over the U.S. since about 1980 that has allowed the Atlantic to warm faster than other ocean basins. In fact, a recent study led by Hiro Murakami of the NOAA Geophysical Fluid Dynamics Laboratory indicates that a substantial portion of the recent Atlantic warming and corresponding increase in Atlantic hurricane activity can be simulated in a global climate model only when the effects of this reduced pollution are accounted for. The bottom line is that there’s plenty of ongoing research on this topic!
References
Bell, G. D., and M. Chelliah, 2006: Leading tropical modes associated with interannual and multi-decadal fluctuations in North Atlantic hurricane activity. J. Climate, 19, 590-612.
Goldenberg, S. B., C. W. Landsea, A. M. Mestas-Nuñez, and W. M. Gray, 2001: The recent increase in Atlantic hurricane activity: Causes and implications. Science, 293, 474-479.
Murakami, H., 2022: Substantial global influence of anthropogenic aerosols on tropical cyclones over the past 40 years. Sci. Adv. 8, eabn9493.
Comments
Very informative article
A Hurricane is forming now in the Tropical Atlantic, and is forecast to move into the Caribbean Sea, and maybe into the Gulf of Mexico in the coming days. ENSO / neutral developed in a negative 2.97 PDO. I would think that neutral meant 0.00 on the PDO. I know the PDO lags behind ENSO, but this has been going on since 2019. I think we have been in ENSO / La Nina since then. The PDO use to fluctuate every two to three months and we would see dramatic changes in the weather patterns. The Solar Cycle # 25 we are currently in could be causing the PDO to remain negative for so long ?
Weather in La Niña
Hmm… What is the Weather in La Niña please make a post about it on climate.gov
Hi Bertram - check out…
Hi Bertram - check out Rebecca's post from June about the current forecast. She includes a list of links to La Nina impacts towards the end.
Category four Cape Verde hurricane - in June
It is troubling that it's still June, yet there is a Cape Verde tropical cyclone that is now a category four hurricane. And, I sincerely hope that this is not a sign of things to come this season.
Regardless, thanks for your hard work, (Mr.? Dr.?) Rosecrans. And, keep up the good work.
With Beryl reaching Category…
With Beryl reaching Category 5 today, I too hope this isn't a sign for the season. I'll relay your message to Matt (Mr. Rosencrans)!
ENSO and the African monsoon
Question: What impact does La Nina have on the monsoon season in Africa north of the equator? What about El Nino or ENSO-neutral conditions?
I know that Mr. Rosecrans explained that the West African monsoon is forecast to be above average this season, but I'm curious to know if there is a relationship between ENSO and monsoonal activity there and elsewhere in northern Africa.
Thank you for reading this, and I look forward to hearing from you.
ENSO and the West African Monsoon
Good question! Yes, ENSO is known to have an impact on the West African Monsoon, which means it can impact precipitation in western and central Africa north of the equator during the monsoon season (June - September). La Nina tends to enhance the monsoon, which brings more precipitation, and El Nino does the opposite. During ENSO-neutral conditions, like what we have now, then ENSO is not much of a factor and other factors, like the sea surface temperature anomalies in the tropical Atlantic, will have a much stronger influence.
Thanks for the explanation
Thanks for the short yet informative explanation about how La Nina affects the West African monsoon season!
RSS Feed is not working
Your RSS feed keeps sending the same post(s) repeatedly.
re: RSS feed
I will pass this on to our Web developers.
nothing obvious
Our web developers have checked the feed for the ENSO blog, viewed it in an RSS reader, and they can't find any obvious issues with it. They also noted that we do not have push notifications at all, so our feed shouldn't be "sending" you anything. If you're still having troubles, feel free to email us through our web contact form, available in our footer with additional details, and we will investigate further.
Add new comment