The North American Monsoon
If you live in the U.S. Southwest or northwestern Mexico, you may already be familiar with the annual climate phenomenon called the North American Monsoon, especially since rainfall in some spots has been way above average this summer. In fact, this monsoon may turn out to be the wettest on record for some places! More on that later… Now, let’s take a sojourn through some North American Monsoon basics (1).
What is the North American Monsoon?
The North American Monsoon is a seasonal change in the atmospheric circulation that occurs as the summer sun heats the continental land mass. During much of the year, the prevailing wind over northwestern Mexico, Arizona, and New Mexico is westerly (blowing from the west) and dry. (Going forward, to avoid having to say “northwestern Mexico, Arizona, and New Mexico” over and over, I’ll refer to this area as “the monsoon region.”)
As the summer heat builds over North America, a region of high pressure forms over the U.S. Southwest, and the wind becomes more southerly, bringing moisture from the Pacific Ocean and the Gulf of California. This circulation brings thunderstorms and rainfall to the monsoon region, providing much of their annual total precipitation.
Water vapor animation for the afternoon of August 22, 2018 showing the monsoon circulation and thunderstorm formation (dark blue, green, dark red). Dry air is shown in orange. Climate.gov image of original from Albuquerque, NM National Weather Service office.
The monsoon starts to develop in Mexico in June, and moves into the U.S. Southwest in July. By early to mid-September, wind patterns have generally reverted back to the westerly pattern, bringing an end to the monsoon. There is some variability in the onset and demise of the monsoon.
What impacts does it have on Mexico and the U.S. Southwest?
Rainfall associated with the monsoon is very important for the region. Northwestern Mexico receives upwards of 75% of its average annual precipitation from it, and Arizona and New Mexico more than 50%, during July–September.
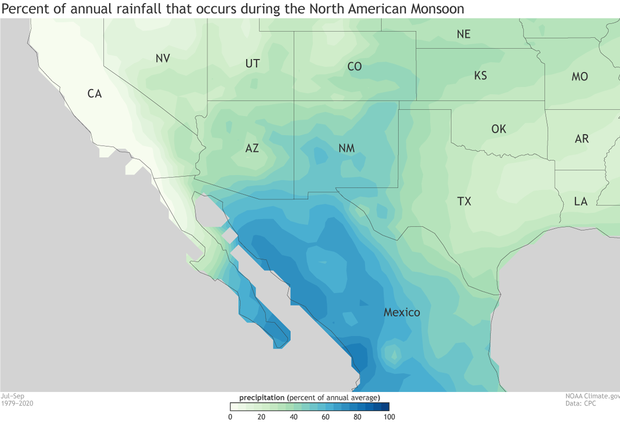
Percent of total annual precipitation occurring during July–September, based on 1979–2020 using CPC Unified rain-gauge-based data. Figure by climate.gov.
For many of us, the word “monsoon” conjures images of heavy rain lasting for months. While that’s often the situation for the Indian monsoon, the monsoon in North America behaves a bit differently. The rainfall generally has a strong diurnal cycle, meaning a daily pattern of mostly dry mornings, storms developing through the day, and most rainfall occurring in the afternoon and evening. Some of these thunderstorms can be strong, delivering heavy rain and frequent lightning. Monsoon rainfall activity tends to be grouped into bursts, with periods of rainy days interspersed with drier periods, rather than rain every day. Also, the occasional eastern Pacific tropical storm can increase monsoon moisture and rainfall.
The impacts of the monsoon go beyond just rainfall amounts. There is also an important relationship between rainfall and temperature: usually, more rain leads to cooler conditions, and less rain leads to hotter conditions. One recent study explored the relationship between the monsoon and wildfires in the Southwest and northern Mexico, finding that monsoon rains were important for ending wildfires.
When was the North American Monsoon discovered?
The rainy season would have been critical for Native Americans for thousands of years, and, for some Native American tribes, continues to be so. Scientists first noted the seasonal rainfall patterns in the Southwest in the early 20th century, with the circulation pattern being understood as monsoonal by midcentury. A couple of field campaigns, including the Arizona-based South-West Monsoon Project (SWAMP, 1993) and the international North American Monsoon Experiment (NAME, 2004), provided a lot of observational data and resulted in a better understanding of the mechanics of the monsoon.
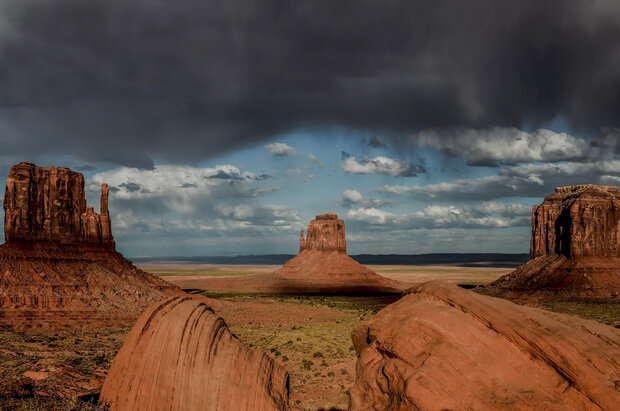
The thunderstorm begins. Photo by Udo S. Title: Monument Valley - Arizona / USA. Taken on September 23, 2017. Used under a Creative Commons license.
What affects the North American Monsoon?
Although there has been a fair amount of research into the monsoon, there are still far more questions than answers about how it works, and if the seasonal amount of rain, potential start date, or other characteristics can be predicted. I listened to the Southwest Climate Podcast from CLIMAS, the Climate Assessment for the Southwest, to learn more about what affects the monsoon and its rainfall, and how Monsoon 2021 is shaping up, and reached out to the podcast co-hosts, Zack Guido and Mike Crimmins, for help with this post.
Rainfall, as anyone who has read the ENSO Blog before will know, is an extremely complicated thing to predict! When you add in the sparse rain-gauge observations available in the U.S. Southwest and Mexico, it becomes even more difficult to make confident statements about the effects of the monsoon and how it can be predicted. In the podcast episode “2021—a generational monsoon?” Zack listed some of the factors that influence how much moisture is available to the monsoon, including the position of the high-pressure area, wind patterns, and transient weather features. Another player is land-surface feedbacks—wetter soils provide more moisture to the air through evaporation.
Zack also mentioned our good friend El Niño! Here at the ENSO Blog, we’re always curious about the role of ENSO (El Niño/Southern Oscillation, the entire El Niño/La Niña system). He pointed out that ENSO does influence Pacific tropical storms, which can supply moisture to the monsoon.
I did a quick comparison of the average July–August rainfall in the monsoon region with the Niño-3.4 index, using 70 years of records. Some earlier studies suggested that El Niño may be related to lower July–August rainfall, and La Niña related to higher rainfall, due to large-scale atmospheric circulation changes. We can see some hints of this relationship in my scatter-plot here.
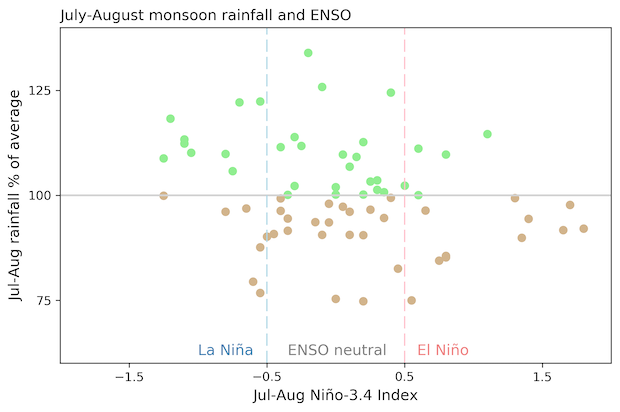
July–August rainfall anomaly averaged over North American Monsoon region for every year 1950–2019 (y-axis) versus Niño-3.4 index (x-axis). Wetter-than-average monsoons (green dots) are slightly more common during La Niña years, while drier-than-average monsoons (brown dots) are slightly more common during El Niño years. Monsoon region averaged over all land gridpoints, 20°N–37°N, 102°W–115°W. Data from Global Precipitation Climatology Centre (GPCC) and ERSSTv5. Figure by Emily Becker.
“Hey! But El Niño leads to more tropical storms than average,” you’re saying, because you’re not new here. “How would that result in less total July–August rain?” Good question! And yet another element of the monsoon system that needs more study to resolve.
How is climate change affecting the North American Monsoon?
Likewise, it’s not yet clear how the monsoon is changing in the warming climate, or how it will in the future. Zack and Mike mention that last year was an extremely dry monsoon, and this year is extremely wet. So is climate change increasing monsoon variability? It’s largely too soon to tell. When you take an already highly variable phenomenon like rainfall, add in uncertain regional climate change impacts, and factor in the sparse data record, it gets difficult to make a strong case about exactly how the monsoon rainfall is changing.
However, while the effect of warming on the storms is uncertain, temperatures have been increasing. The warming conditions alone can be impactful, drying out soils quicker during breaks in monsoon rainfall, for example (2).
The recent Intergovernmental Panel on Climate Change (IPCC) Sixth Assessment Report covers observed and potential future changes in the North American Monsoon. Regarding changes that have already occurred, the report finds modest evidence that the monsoon rainfall has intensified since the 1970s, and this has been partly attributed to greenhouse gas emissions. On the other hand, there is not much agreement among projections for future change in the monsoon, except for regarding the timing—most projections suggest that, under continued climate change, the monsoon will start later in the summer and end later in the fall than it currently does (3).
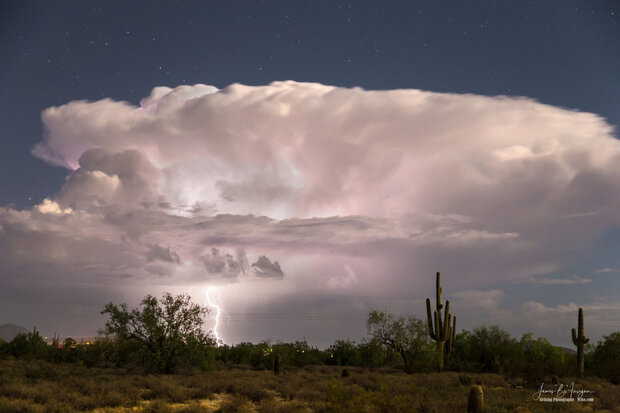
Arizona monsoon cloud with lightning striking the beautiful Sonoran desert in North Scottsdale. Photo by James Bo Insogna. Title: Arizona Monsoon Thunderstorm. Taken on August 15, 2016. Used under a Creative Commons license.
What about this year?
It depends where you are! Zack and Mike described this year’s monsoon for southern Arizona as “generational,” meaning once in a generation. It’s not over yet, but possible that the overall monsoon rainfall in Arizona will end up being the highest on record. Some regions have received more than 200% of the average rainfall, and Tucson recorded its wettest month ever this July. On the other hand, New Mexico and northern Mexico are near or a bit below average.
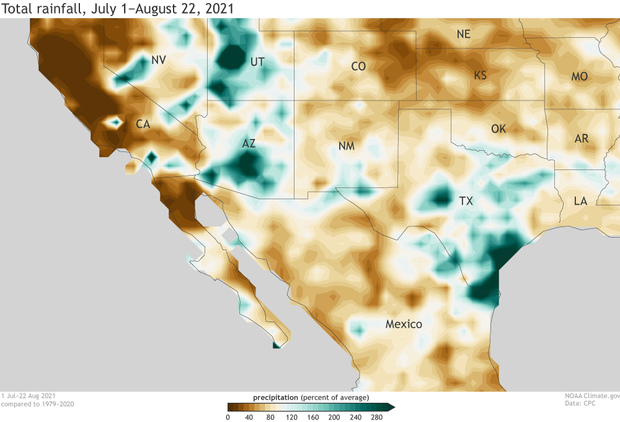
July 1–August 22, 2021 precipitation shown as a percent of the average July 1–August 22, based on 1979–2020. Brown indicates where precipitation has been less than average; green is greater than average. Figure by climate.gov; data from CPC Unified data.
While this will help with the ongoing drought in the southwest, in many regions the precipitation deficit has been building for a long time. The current drought outlooks expect that the drought in Arizona and New Mexico will improve in the short term, but persist. Check out Tom’s recent post on the drought in Arizona to understand more about how drought works in this region.
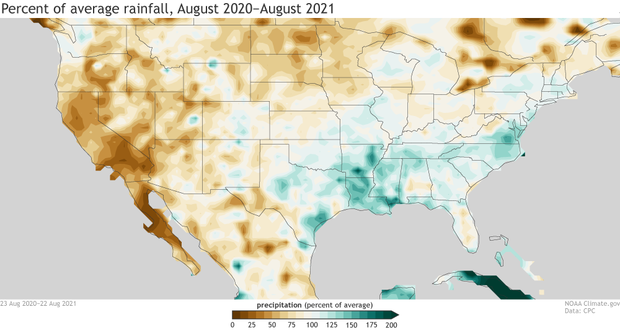
Precipitation accumulation over the past 12 months, shown as a percent of the average mid-August through mid-August total. Despite the monsoon rainfall this year, much of the region is still in a precipitation deficit. Average is based on 1979–2020 using CPC Unified data. Figure by Climate.gov.
Thanks for visiting the North American Monsoon region with me! I’ll be back on my regular beat in a couple of weeks with the September ENSO update. See you then!
Footnotes
(1) The North American Monsoon, published in the Bulletin of the American Meteorological Society by David Adams and Andrew Comrie, provides a comprehensive overview of the North American Monsoon and related research through the late 20th century.
(2) In fact, comparing 1955, a year with very similar total rainfall in Tucson as this year, to this year shows temperature between July 1 and August 23 were on average more than 2 degrees F warmer.
(3) There is a whole lot of interesting detail in this report—about everything, but about the North American Monsoon specifically. I’ve summarized their conclusions above, and include the quotes here, but I suggest you head over to the full science report if you’re in the mood for some specifics. In chapter 8.3, How is the water cycle changing and why?, the report states “In summary, both paleoclimate evidence and observations indicate an intensification of the NAmerM in a warmer climate (medium confidence). The intensification recorded since about the 1970s has been partly driven by greenhouse gas emissions (medium confidence).” In 8.4, What are the projected water cycle changes?, the summary statement is “there is low agreement on a projected decrease of NAmerM precipitation, however there is high confidence in delayed onsets and demises of the summer monsoon.”
Comments
Wind, Rain, and that Springtime barrier
Well those extra storms probably just go somewhere else because of the change in wind pattern that the El Nino brings, eh? At any rate I'd just like to point out a potential clue to your springtime predictability barrier problem. You mentioned, if I understood correctly, that a La Nina pattern during winter months leads to an increase in the North American Monsoon in late summer. That's at least one part of a very big climate puzzle crossing that barrier that involves both the ocean and atmosphere. Not really sure if it's possible to even find that rabbit hole let alone getting to the end of it :) Good luck.
California Component
Although on the western edge of the North American Monsoon, California plant geography indicates it makes a large contribution to the state’s southern flora. For example San Diego county has a population of azalea otherwise not seen for hundreds of miles to the north. Also found are a number of tree species with a disjunct distribution. We are largely unaware of this precipitation because of the Southern California Chamber of Commerce and a lack of rain gauges.
Tropical Storm Nora
What happened that make TS Nora so underwhelming? Forecasts had all of this widespread flash flooding. There were spots that received large amounts of rain, but overall Nora was a bust. Is the tropical storm season done for this part of the country?
Gulf of Mexico
The satellite loop in this post shows Gulf of Mexico moisture moving west into the monsoon region. Seems likely that conditions in the GM may influence annual variations in the monsoon. Thanks that’s a big pool of warm water larger than the gulf of California and warmer than the greater Pacific Ocean.
Comments have been disabled on this article