Zooming in on some of NOAA’s latest seasonal hurricane forecast research
Although the tropical Pacific usually takes center stage here at the ENSO Blog, we can’t help but take a peek at the tropical Atlantic now, with Tropical Storms Arthur and Bertha giving an early start to an Atlantic hurricane season that NOAA recently predicted to be an active one. Given this, it’s a good time to give a brief rundown of some of the latest and greatest advances in seasonal tropical cyclone prediction research from the NOAA lab in which I work, the Geophysical Fluid Dynamics Laboratory (GFDL). Because I am not a tropical cyclone expert, my colleague and tropical cyclone prediction guru Dr. Hiroyuki Murakami has kindly offered his assistance with this post. Without further delay, let’s get started!
Predicting little whirls on a big planet
As guest author Dr. Phil Klotzbach previously mentioned, seasonal Atlantic hurricane outlooks began in 1984 with the pioneering work of Dr. William Gray at Colorado State University. Today, many other universities, private sector companies, and government agencies issue their own hurricane outlooks. Most of these outlooks are produced by understanding links between Atlantic hurricanes and either observed climate indexes (like ENSO) or large-scale climate factors predicted by dynamical forecast models (1). In recent years, the latest advances in global climate modeling, brought to you by experts like Dr. Murakami, have allowed our seasonal forecast systems to simulate individual tropical cyclones (the general term for intense tropical low-pressure systems that include hurricanes).
For dynamical forecast models to simulate tropical cyclones and predict their seasonal statistics, the models must accurately predict large-scale environmental factors, like ENSO, that also have a season-long influence. In addition, they need fine enough resolution in the atmosphere to capture small-scale variations in wind, rain, and clouds that make up the tropical cyclone structure. To simulate atmospheric and oceanic motions, computer models must divide up the planet into a grid of cells (like the graphing paper you may have used in school, but in three dimensions instead of two and the sides of each grid are not necessarily the same length). The more grid cells in a model, the more computationally expensive it is to run the model. To simulate a tropical cyclone, you need a lot of grid cells. This combination of large spatial scale, long seasonal time scale, and large number of grid cells is a major challenge in climate model design and computational power.
One forecast model that has met this challenge is the GFDL Forecast-oriented Low Ocean Resolution (FLOR) model, which is a member of the North American Multi-Model Ensemble that we often consult for our ENSO forecasts. FLOR saves on computing time by using a coarser grid in the ocean, while the atmospheric grid is fine enough (about 30 miles along each side in the horizontal direction) to simulate tropical cyclones with realistic features. In fact, the work led by Dr. Murakami and his colleagues has shown that FLOR is able to provide skillful seasonal forecasts of Atlantic tropical storm and hurricane activity several months in advance.
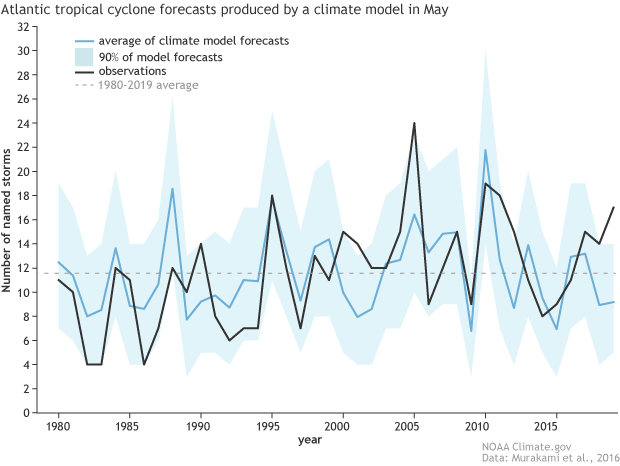
A comparison between actual and predicted Atlantic named tropical storms in the July – November season from 1980 through 2019. The black line shows the actual values, and the blue line is the average of all predictions produced by the Forecast-oriented Low Ocean Resolution (FLOR) global climate model that was run in early May before each Atlantic hurricane season. (The forecasts before 2015 are retrospective forecasts because they were run after the hurricane season occurred but with conditions that were only known in May of that year.) Each forecast consists of 36 simulations (ensemble members) with slightly different initial conditions and three slightly different versions of FLOR (12 ensemble members each). The blue shading shows the range of 90% of all forecasts, providing a measure of forecast uncertainty. NOAA Climate.gov figure adapted from Murakami et al. (2016).
For example, the forecasts produced by FLOR in early May have been able to predict some of the very active Atlantic hurricane seasons, like in 2010, and some of the less active than normal seasons, like in 2014 and 2015. The correspondence between the FLOR May forecast and actual Atlantic named storm numbers is far from perfect (the agony of seasonal forecasting!) but accurate enough to provide a tilt in the odds (2). As a result, Dr. Murakami submits the FLOR seasonal tropical cyclone forecasts each year to NOAA forecasters for their consideration before they issue their Atlantic Hurricane Season Outlooks.
It’s worth noting that Dr. Murakami and his colleagues have shown a notable improvement in FLOR’s Atlantic tropical cyclone forecast performance for predictions issued after May (3). A big reason is that ENSO forecasts improve considerably once we push past the spring predictability barrier. Better ENSO forecasts mean better Atlantic tropical cyclone forecasts because of the long-distance influence of ENSO on Atlantic hurricanes.
Think bigger by going smaller
Although FLOR can simulate tropical storms and lower-intensity hurricanes, the model is unable to simulate the major hurricanes – Category 3, 4, and 5 storms on the Saffir-Simpson Scale – that are responsible for about 85% of the total tropical cyclone damage in the U.S. That’s because the processes that lead to intensification, like the inward and upward flow of air within the eyewall, take place over very small distances—smaller than most models can resolve.
Fortunately, the team at GFDL developed an even higher resolution version of FLOR, aptly named HiFLOR, that addresses this shortcoming. By shrinking the atmospheric grid cells horizontally to about 15 miles on each side, HiFLOR can simulate a realistic distribution of all types of Atlantic tropical cyclones, including major hurricanes. Perhaps more impressively, Dr. Murakami and his colleagues have shown that HiFLOR skillfully predicts the Atlantic basin total and even regional patterns of where major hurricanes occur.
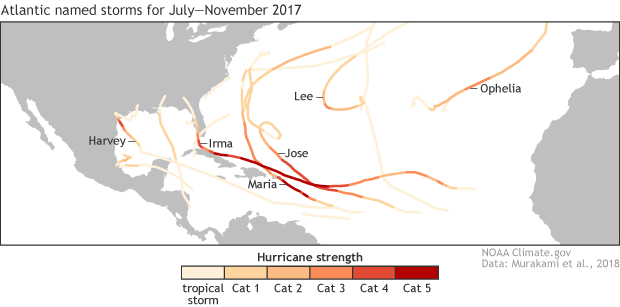
The 2017 Atlantic hurricane season was extremely active with 17 named storms, 14 of which occurred between July and November. Six storms, labeled above, reached or exceeded Category 3 strength on the Saffir-Simpson scale.
A notable example was the costly 2017 Atlantic hurricane season, which was unusually active, especially in the eastern Caribbean and extending northwest into southern Florida. Major hurricanes Irma and Maria brought devastation to parts of the Leeward Islands, Cuba, Florida, the Bahamas, and Puerto Rico. HiFLOR predictions made in early July indicated an elevated likelihood of major hurricanes in the part of the Atlantic that coincided closely with the paths of these devastating hurricanes. An advantage of being able to simulate the major hurricanes in global climate models is that scientists then can design experiments to probe the causes of unusual activity (such as the factors in Emily’s recent post). For example, the research led by Dr. Murakami demonstrated that the enhanced occurrence of eastern Caribbean major hurricanes in 2017 seems to have been strongly driven by the elevated sea surface temperatures in the tropical Atlantic rather than the developing La Niña that fall.
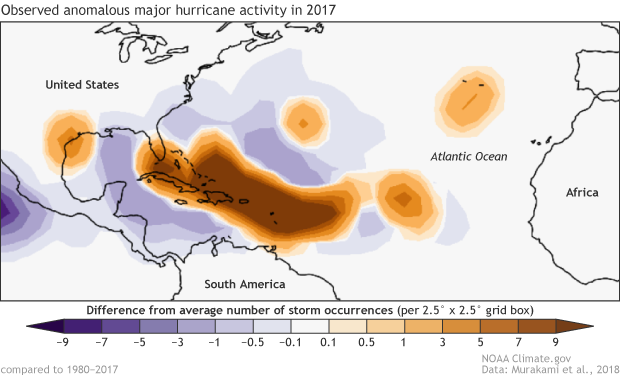
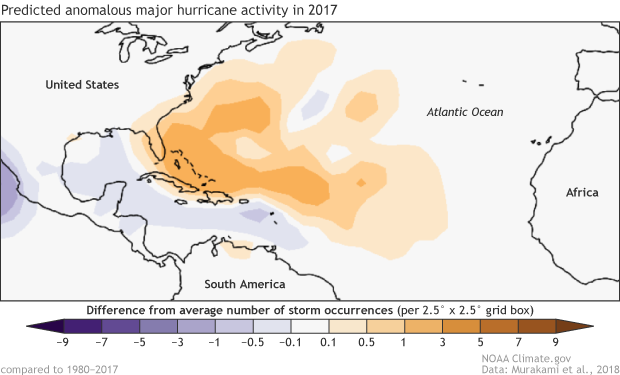
(Top) Major hurricane (Categories 3-5) activity in July – November 2017 was unusually strong in the region extending from the eastern Caribbean northwestward into southern Florida, with Hurricanes Irma and Maria causing widespread devastation. This unusual activity is shown as strongly positive values in this map of major hurricane density anomalies, which measure the anomalies (deviations from the 1980-2017 average) of major hurricane occurrences (calculated at every 6-hour time step) within a 2.5° by 2.5° grid cell. The final value is multiplied by 10, so a value of 10, for example, means that the region experienced 1 more major hurricane occurrence than average. (Bottom) This general pattern of major hurricane activity was well predicted in early July of 2017 by the High-resolution Forecast-oriented Low Ocean Resolution (HiFLOR) climate model. NOAA Climate.gov figure adapted from Murakami et al. (2018).
Dial it up to 11?
If HiFLOR shows so much promise for hurricane-season prediction, why don’t we just make all seasonal predictions with high-resolution global climate models? If only it were that easy! For one thing, there’s a big tradeoff between climate model resolution (the number of grid cells) and computational power. HiFLOR requires several times the computer resources as FLOR, and so it is too computationally expensive to run HiFLOR as routinely as FLOR. As a result, Dr. Murakami and the GFDL team selectively run the HiFLOR seasonal forecasts a few times before and during the Atlantic hurricane season to investigate interesting prediction challenges, and they offer the results to the Climate Prediction and National Hurricane Centers as one source of guidance for them to consider. (4).
Perhaps most encouragingly, the success of a high-resolution global climate model in predicting regional patterns of the costliest, highest-intensity hurricanes bodes well for the future of seasonal hurricane forecasting. Dr. Murakami is cautiously optimistic that operational forecasts may one day go beyond the prediction of Atlantic basin storm totals by also providing useful regional-scale information, like possibly seasonal forecasts for enhanced or suppressed chances of storm landfalls in particular parts of the Atlantic basin. Pushing this frontier requires continued developments in both global climate modeling and the science of tropical cyclones. We can be sure that Dr. Murakami and many other tropical cyclone specialists will continue doing their best to push those bounds of seasonal hurricane forecasting!
Special thanks to Dr. Hiroyuki Murakami for providing input and figures!
Footnotes
- For a comprehensive summary of current seasonal tropical cyclone forecasts and methods, see this review article led by Dr. Klotzbach.
- A common measure of the relationship between two variables, as described previously in this post, is the correlation coefficient. The correlation coefficient ranges in value from -1 (opposite relationship between the two variables) to 1 (perfect relationship), with a value of zero indicating no relationship. In the case of the May Atlantic tropical storm forecasts produced by FLOR, the correlation between ensemble averaged forecast and actual values is 0.47, which indicates a moderate positive relationship between the forecast and actual values.
- For example, the correlation coefficient between forecast and actual Atlantic named storm numbers rises from 0.47 for early May forecasts to 0.61 for early June forecasts.
- Although GFDL has a research-driven rather than an operational mission, operational forecast centers generally use similar climate models, and they also have similar computational constraints for seasonal prediction. For example, the National Centers for Environmental Prediction also run a higher resolution version of the CFSv2 (about 25 miles along each side of the atmospheric grid) before and during the Atlantic hurricane season to provide forecast guidance for NOAA’s Atlantic Hurricane Season Outlook.
Comments
Comment
Comments have been disabled on this article